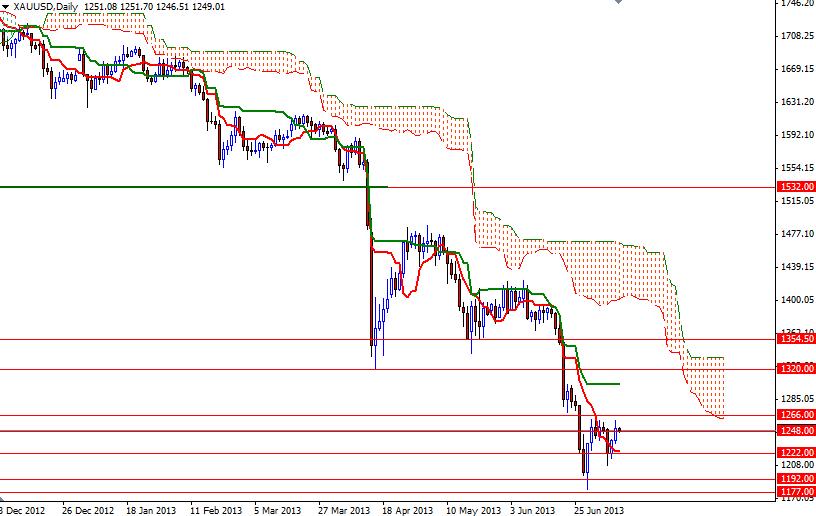
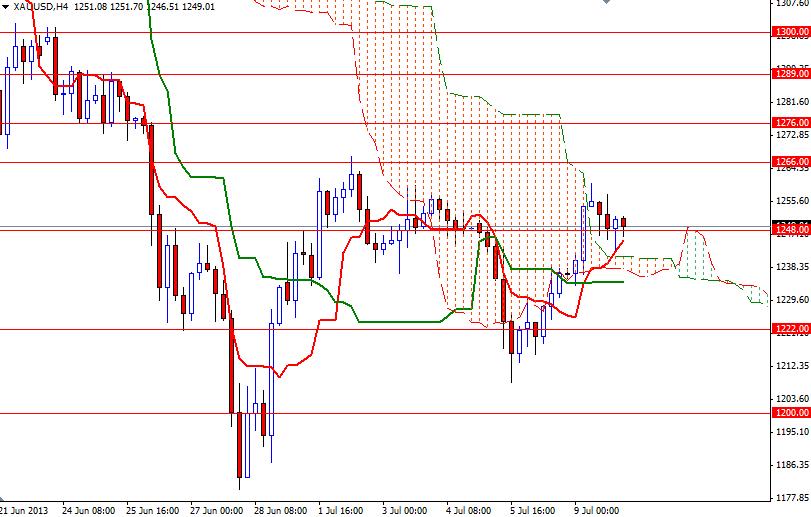
The XAU/USD pair (Gold vs. the Greenback) rose two days in a row as some investors continued to cover their short positions after the Chinese consumer price index data came out higher than expected. Gold prices managed to close the session above the Ichimoku cloud (4-hour time frame) although the American dollar got a boost after S&P downgraded Italy’s credit rating to BBB from BBB+ and ECB Executive Board member Joerg Asmussen said that the ECB's policy will remain accommodative for an extended period. Today's main event will be release of the minutes of the Federal Open Market Committee meeting held on June 18-19. The minutes provide some useful insight into what the voting members were thinking at that time. From a technical point of view, the broader directional bias remains weighted to the downside. The weekly and daily charts remain bearish while the pair is trading below the Ichimoku cloud. We also have bearish Tenkan-Sen (nine-period moving average, red line) - Kijun-Sen (twenty six-day moving average, green line) crosses on both charts. However, 4-hour chart paints a different picture. It appears that the bulls are trying to increase the pressure and because of that I will be watching the 1266 and 1234 levels today. If the bulls manage to shatter this critical barrier, it is technically possible see a short-term bounce targeting the 1300 level. On its way up, there will be resistance at 1276 and 1289. If the bears take over and push gold prices below 1234, then the next stop will probably be the 1222 level. If this support gives way, we might be revisiting the 1208.30 - 1200 zone. A weekly close below 1200 would confirm that the momentum is once again turning bearish.