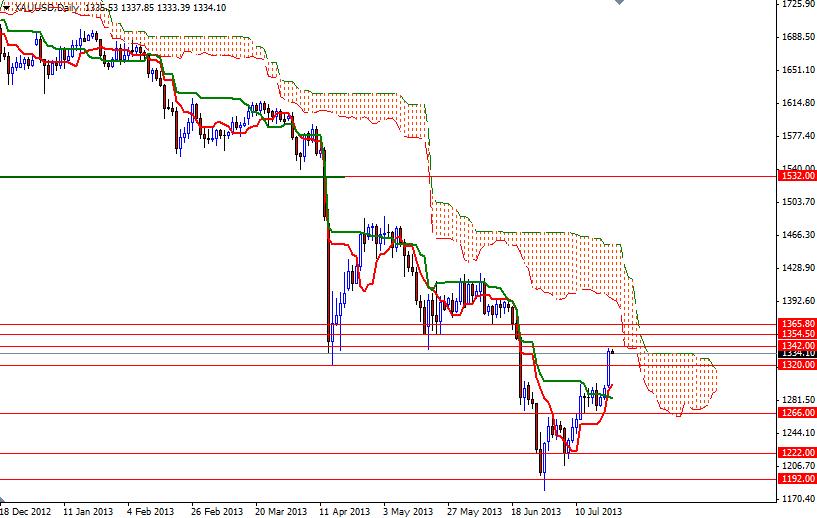
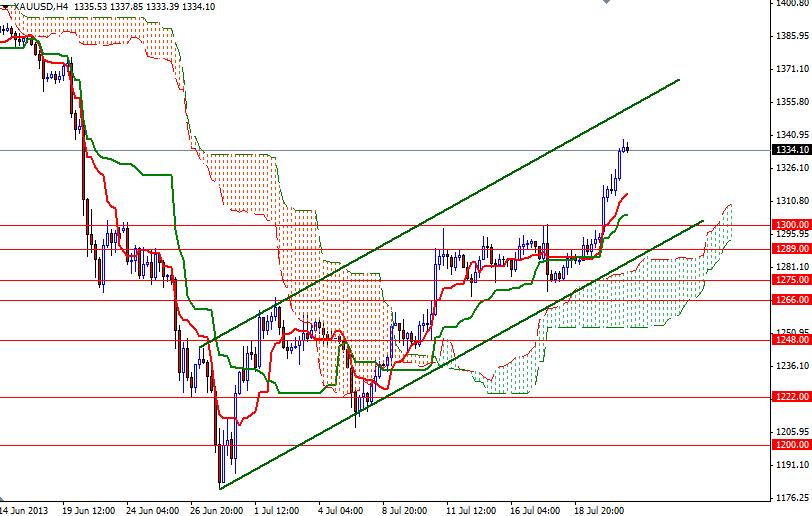
The XAU/USD pair produced a nice bullish candle after it pulled itself out of the bears' grip and broke above the 1300 level which has been a cap on prices for the last seven trading days. Poor U.S. Existing Home Sales numbers and expectations that the Federal Reserve will remain hyper active for a while helped gold prices to reach the highest level since June 21. Data released from the National Association of Realtors showed that sales fell 1.2% to an annual rate of 5.08 million. In my previous analysis I had mentioned the importance of the 1300 resistance level. Not surprisingly, the pair accelerated its ascend right after we climbed above this critical resistance level. From a purely technical point of view, it is possible that prices will continue its bullish tendencies and try to push through the resistance level at 1354.50. However, on the daily time frame, the XAU/USD pair is still trading below the Ichimoku clouds. Therefore, I think it is too early to say that the bearish trend -which began in October 2012- is over. There are strong resistance levels ahead such as 1365.80, 1376 and 1388 where the Ichimoku clouds reside on the daily chart. Failure to break above the clouds may bring sellers back to the market. Usually, when an important support/resistance level is broken, the market responds and retests it again. In other words, investors should pay extra attention to the 1320 (which happens to be the 23.6 Fibonacci levels based on the bearish run from 1795.75 to 1180.21) and 1300 support levels. Today sees release of important economic reports from the United States such as new home sales and flash manufacturing PMI, so expect volatility.
Gold Price Analysis - July 23, 2013
By Alp Kocak
By Alp Kocak
Alp Kocak has been trading Forex since 2003. He writes technical analysis based on Japanese candlesticks and Ichimoku Kinko Hyo.
Subscribe
Sign up to get the latest market updates and free signals directly to your inbox. Please enter a valid email address

By Alp Kocak
Alp Kocak has been trading Forex since 2003. He writes technical analysis based on Japanese candlesticks and Ichimoku Kinko Hyo. - Labels
- Gold


