By: DailyForex.com
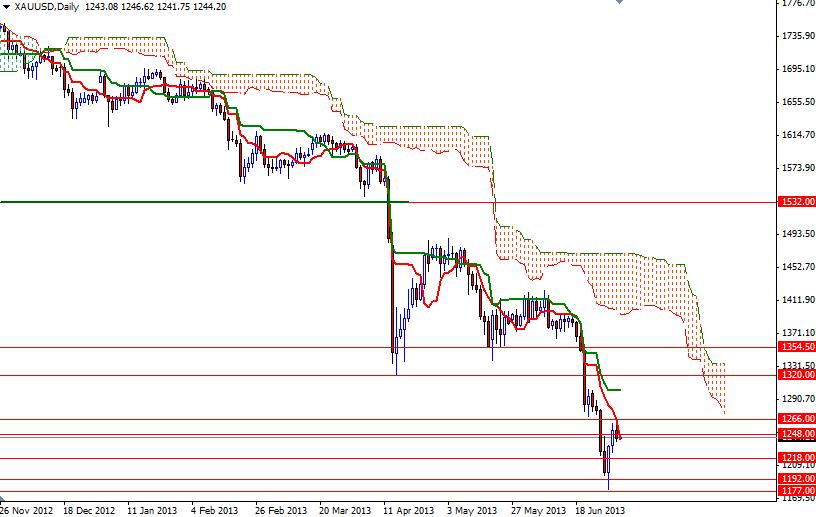
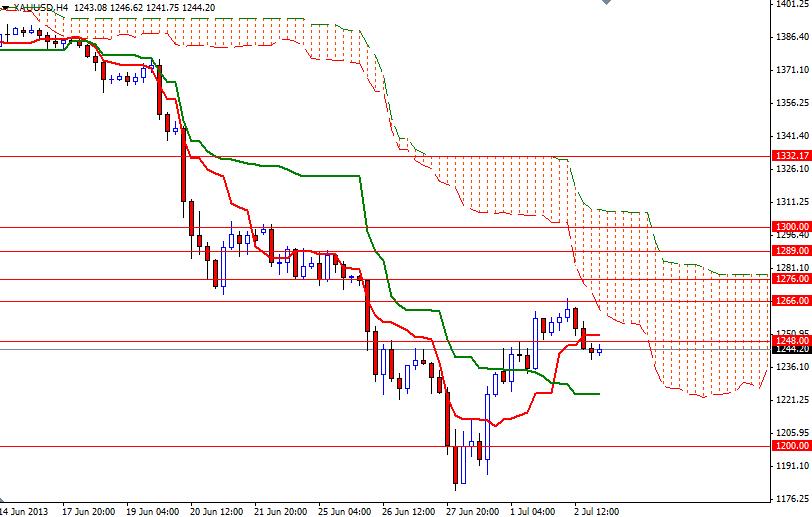
The XAU/USD pair closed slightly lower than opening on Tuesday as the American dollar gained strength across the board after a report released from the U.S. Commerce Department showed that factory orders climbed 2.1% in May after a revised 1.3% increase in the prior month. Strength in the American dollar tends to weaken the appeal of commodities such as gold. The XAU/USD pair initially traded higher but encountered some resistance at the 1266 level. Yesterday's candle suggests that the trading action is getting tight and gold traders simply aren’t interested in going too far out on the risk spectrum ahead of important economic data releases such as ADP non-farm payrolls, ISM non-manufacturing PMI and government's monthly jobs report. In the short term, the upside may be limited with players taking profits. This also makes sense because prices are approaching the Ichimoku clouds on the 4-hour time frame. Because of that, I think the pair will be trapped in the 1276 - 1223 area until Friday. On the 4-hour chart, Tenkan-sen line (nine-period moving average, red line) crossed over the Kijun-sen line (twenty six-day moving average, green line) but prices are still below the Ichimoku cloud. That means the bulls have to climb and hold above the 1276 level in order to gain enough strength to challenge the bears at 1320 but before that expect to see some resistance at 1289 and 1300. If the bears manage to hold the pair below the 1248 level, we might revisit the support level of 1223. Below this level, there will be additional support at 1218 and 1200.