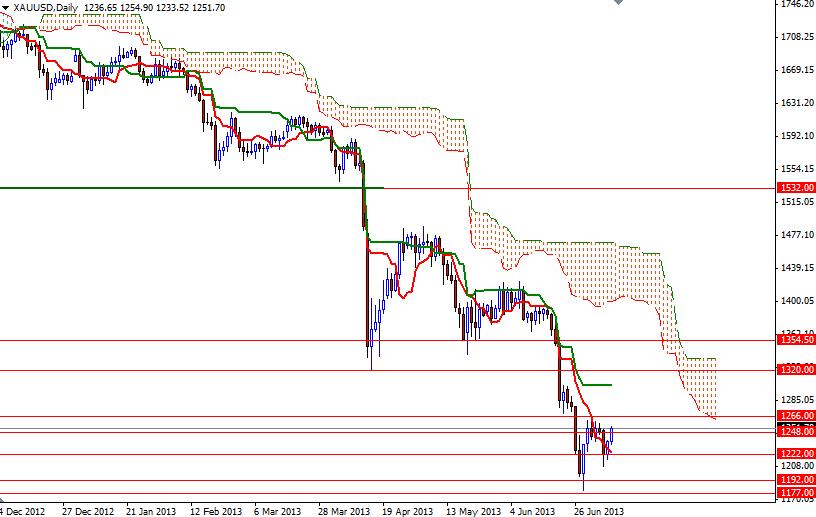
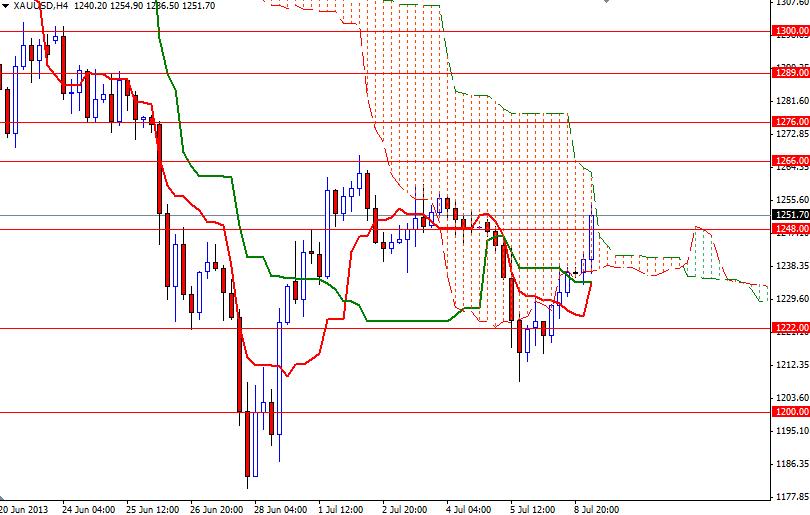
The XAU/USD pair had a positive day as the adrenalin rush of a decision by the Federal Reserve to start trimming the bond purchases wore off. The recent price action shows that some investors accelerated profit taking. In my previous analysis, I had mentioned that Friday's settlement occurred at an important level and climbing above the 1230.55 and 1248 resistance levels yesterday suggest the bulls might be heading towards 1266. The XAU/USD pair is currently trading at the 1251.70 level which converges with the top of the Ichimoku cloud on the 4-hour time frame. If the bulls are planning to push gold prices higher, this might be a good opportunity because the cloud (which represents the resistance in our case) is thin. The thickness of the Ichimoku cloud is important because the thicker the cloud, the less likely it is that prices will manage a sustained break through it. The thinner the Ichimoku cloud, a break through has a better chance. If the bulls manage to keep gold prices above the cloud on the 4-hour chart, you may also have a bullish Tenkan-sen (nine-period moving average, red line) - Kijun-sen line (twenty six-day moving average, green line) cross. A daily close above the 1266 resistance level indicates that the pair may extend its bullish movement. If that is the case, expect to resistance at 1276, 1289 and 1300. If the bulls run out of gas and prices reverse, we will probably see support between 1238.62 and 1234.18. Below this level, there will be additional support at 1222 and 1208.30.