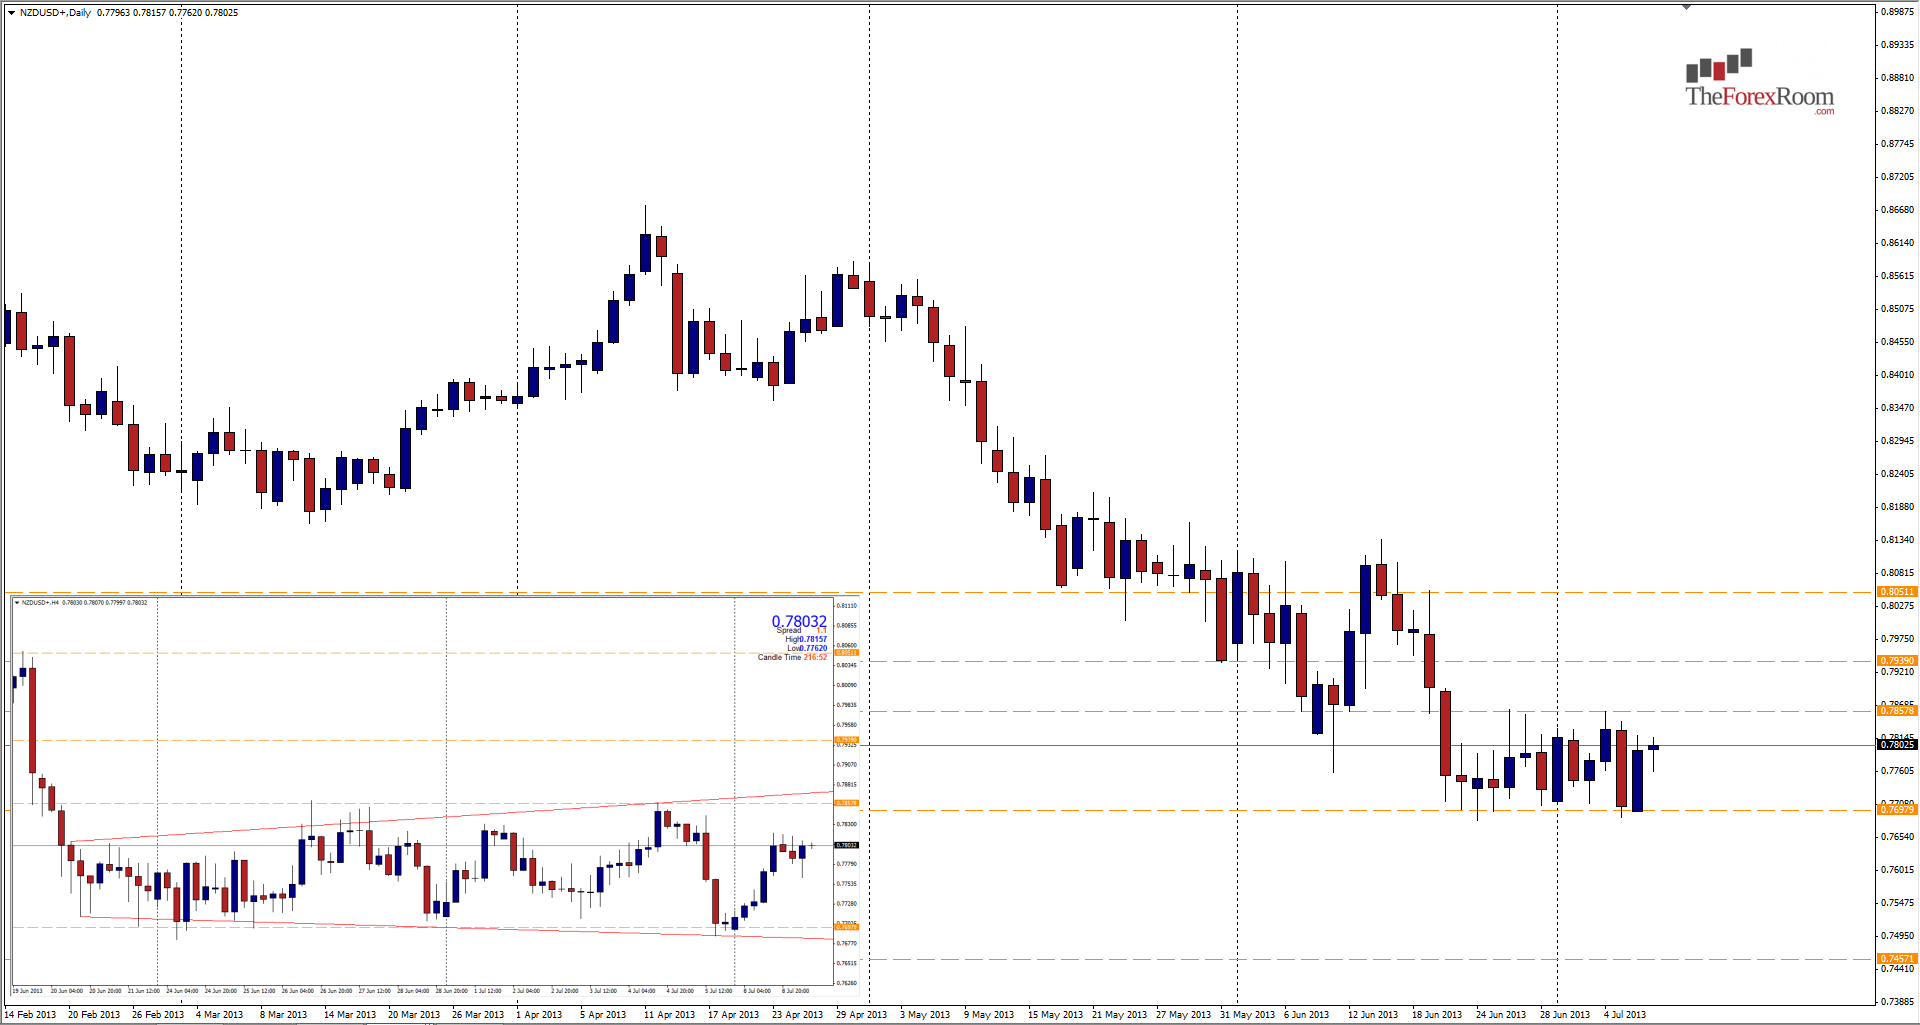
The Kiwi, as we traders like to call it, (aka the NZD/USD pair) has once again managed to retreat from the 0.7700 area that has been propping the pair up for the last 2 weeks, making the daily chart look like an accordion rippling back and forth. Held in check on the top side by the 0.7860 level, the pair is trading in roughly a 160 pip range, albeit a slightly expanding one. On a 4 hour chart the action over the last 2 weeks is forming an expanding wedge pattern and is poised to break out in one direction or another. Considering the pair’s reluctance to fall below 0.7700, a possible top side correction is in order which could see the pair challenge 0.7940, the May 2013 low, or possibly 0.8050 at the November 2012 low and a level that held the pair up for most of May this year also. To the downside, only a close below 0.7690 on a 4 hour or higher will convince this trade that the bears are in control and at that point one would be prudent to follow the trend down to around 0.7450 where we have lows from March 2012, November 2011 and highs from November 2004.
Happy Trading

