
As the currency of a major gold-producing country, the AUD has been highly positively correlated with the price of gold. Both have made major upward and downward moves in recent years. AUD/USD tends to move quite cleanly and symnetrically. Although not one of the major pairs, these factors have made it interesting. It also has a rare characteristic: it can be active around the clock, and therefore convenient for traders in all time zones.
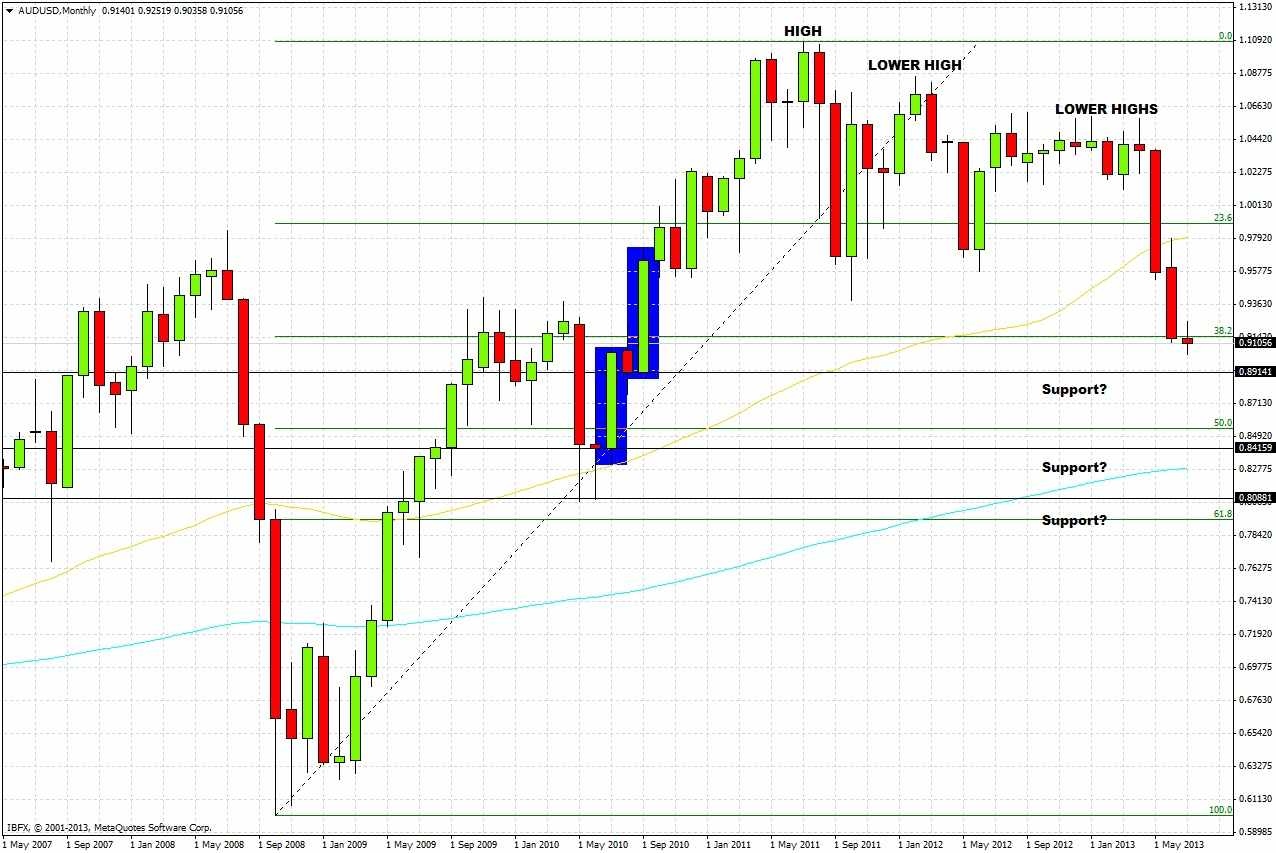
AUD/USD has been falling sharply for the last two months, and has been making lower highs since July 2011, shown in the monthly chart below. It broke strongly through the 50 SMA (the gold line).
Trading with the trend, it makes sense to continue looking for shorts.
If we are looking for possible turning points to spot long-term long entries, we can identify some high-probability reversal points:
1. The green candles shaded in blue are bullish reversals. We are already within the zone of the higher candle, which opened at 0.8914.
2. The area of the lower shaded candle looks more interesting, as it was the beginning of the bullish move that brought the price up to the level from where it has been falling. The open of this candle at 0.8414 is very near to the closes of its previous two candles, and is also close to the 50% fibonacci retracement of the long bull move from 2008-2011.
3. The low of the lower shaded candle at 0.8305, which is currently close to the 200 EMA (the blue line in the chart).
The monthly chart is telling us that the price should fall to 0.8914. If it then continues down to the 50% retracement at 0.8543, it will have reached a higher-probability long term reversal zone stretching to 0.8305.
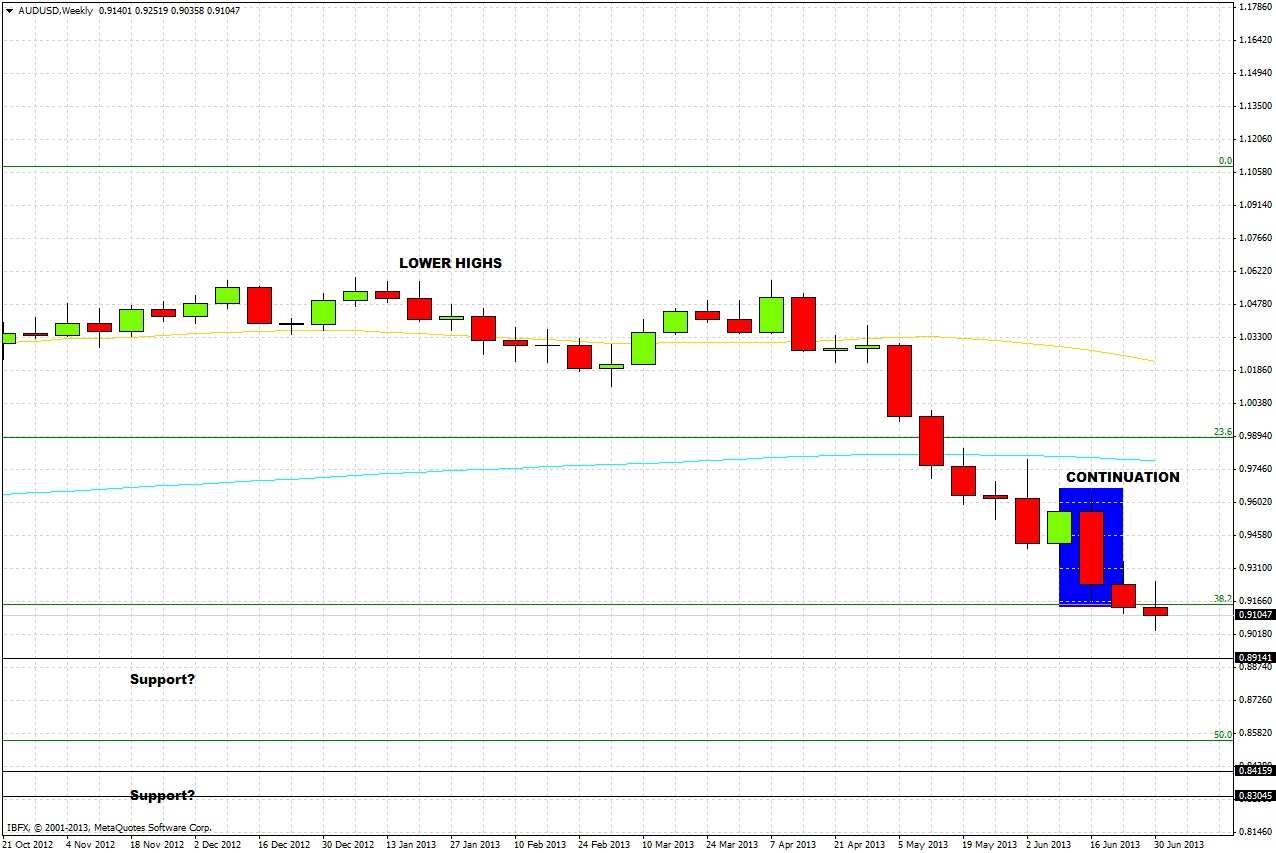
The weekly chart confirms it is wise to look for shorts until at least 0.8914. The week before last was a bearish reversal of the first pull-back within this down-trend: a good continuation signal. This week has already made a lower low.
Drilling down to the daily chart, there are several encouraging signs for shorts. We are in a smooth down trend, shown by the 50 SMA and channel lines. The lower channel line is still almost 200 pips below the price. Tuesday saw a bearish reversal, a similar continuation signal to what we saw on the weekly chart. The RSI-14 is close to 30 and has been below 50 for a long time, indicating strong bearish momentum. Stochastics are bearish but not yet showing an oversold reversal.
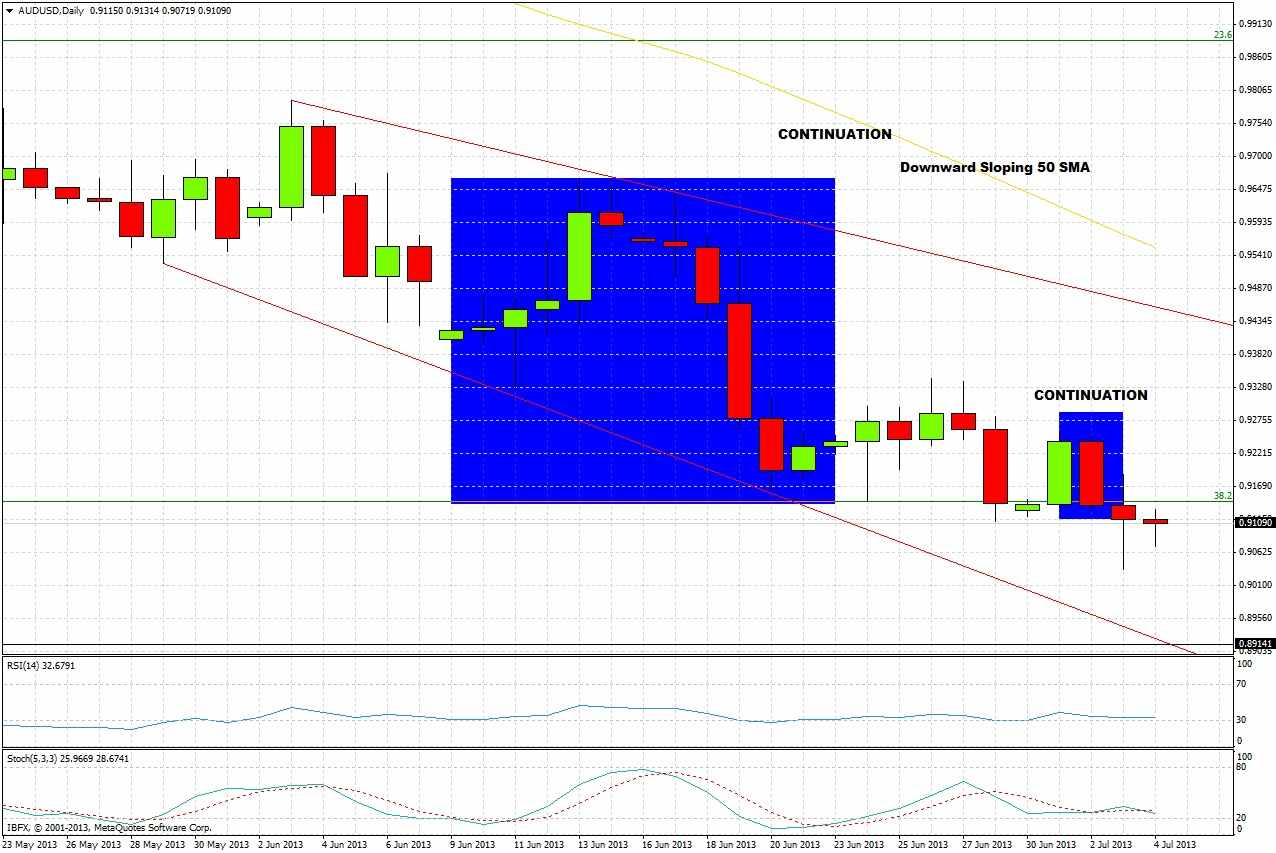
A good entry point from now until the close of tomorrow's London session would be at a reversal from a retrace to yesterday's high of 0.9189. An initial target is yesterday's low of 0.9036, more aggressive targets are the potential support levels of 0.8914 and the 50% fibonacci level at 0.8543.