Last Wednesday 10th July I wrote a technical analysis of this pair. The very same evening, the Chair of the Federal Reserve made a statement that made a dramatic impact on the market's sentiment regarding the USD, sending it universally lower very rapidly in just a few hours. Let's see how my predictions last week held up in the face of this turnaround:
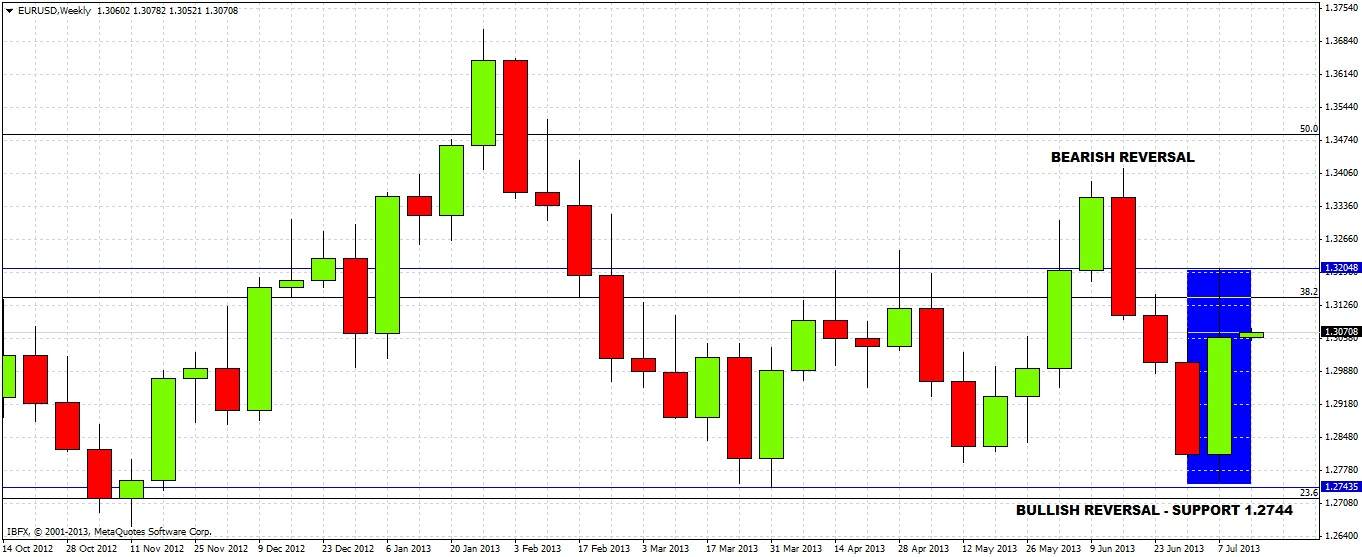
1. Should the price break 1.2744 with momentum, it should continue down to 1.2661, and if that level were broken a further move down to 1.2385. I saw the level of 1.2744 being key due to the bullish monthly reversal zone with an unbroken low of 1.2744. This low did in fact hold.
2. The outlook is strongly bearish, but it may take a while for the key level of 1.2744 to be broken, although any pull-back is likely to be short-lived. The change in sentiment overrode the bearish outlook, and the “pull-back” may well now be a reversal.
3. If the price fails to break 1.2744 by this time next week we will probably see the establishment of some kind of bullish pull-back. However a break of 1.2744 seems very likely to happen soon given the very strong downwards pressure overall. A break of 1.2744 now seems nowhere in sight. Again, the change in sentiment overrode the bearish outlook.
My forecast of a break of 1.2744 to the downside was wrong, but my identification of that level as crucial support that would herald some kind of an upswing if not broken within a week seems to have been proven correct, provided it holds for another three days.
Technically, the action of the second half of last week has left EUR/USD with a bullish outlook, reflecting the market's change in sentiment regarding the USD.
The week that has just closed printed a bullish reversal bar, with the 7-month low of 1.2744 holding comfortably:
We are likely to see a retest of last week's high of 1.3205 before we see a retest of the low of 1.2744. However the fact that the move up Wednesday night was enormous makes it likely that we are going to see price consolidate for a while. The price has also fallen considerably off last week's high, and it is hard to tell whether this was due to real selling pressure above, or just a natural result of a very sudden over-extension of the price.
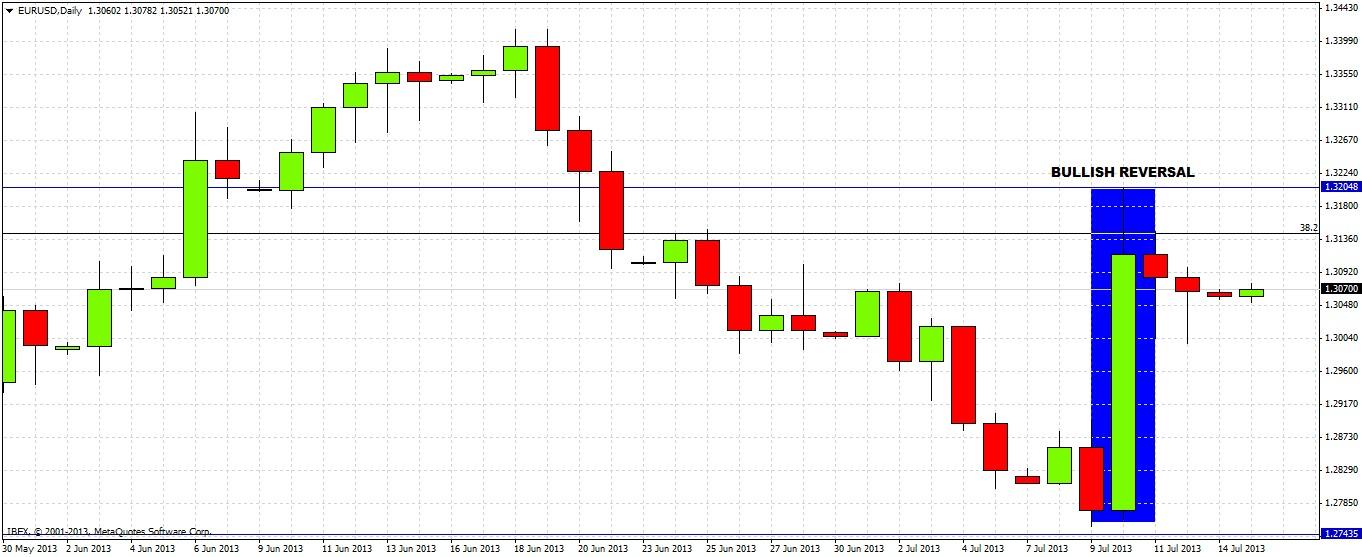
We have to turn to the daily chart for more clues:
Here we see Wednesday's move up was a spectacular bullish reversal, taking out the previous ten trading days! We can also see that despite the two lower closes since the move up, the long lower wicks show some buying close to 1.30.
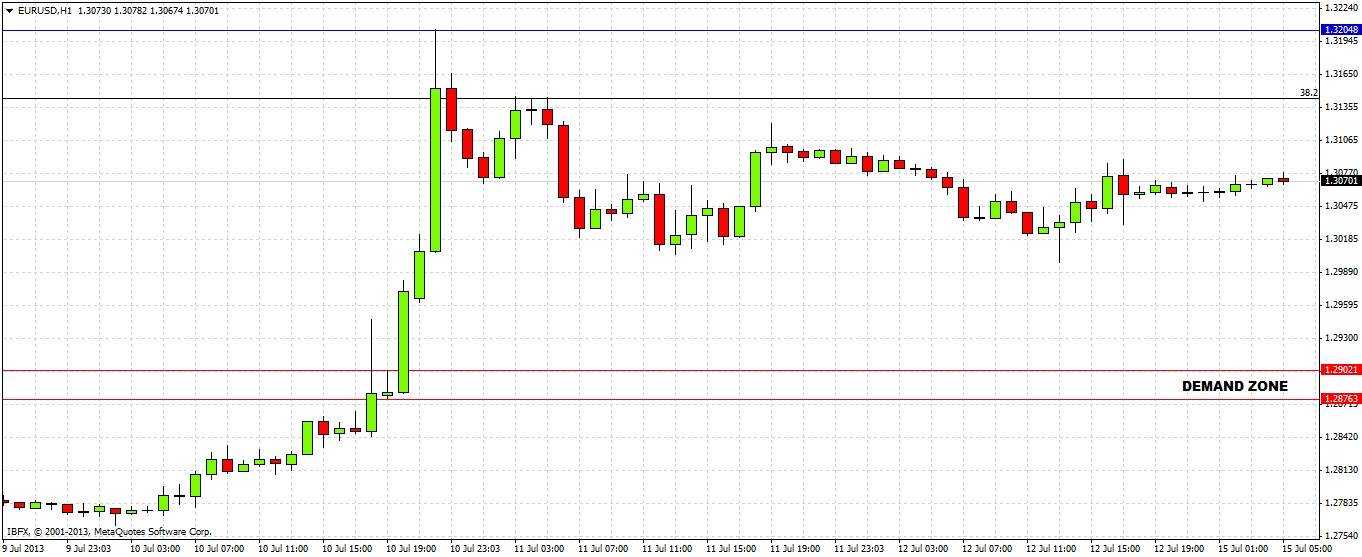
Things still look bullish but a bit unclear and so it is helpful to drop down even further, to the hourly chart:
We see here that the demand zone from where the sharp move up began is the inside hourly bar from 1.2876 to 1.2902:
In conclusion:
1. The outlook is now bullish.
2. The surest move of the coming week or so is likely to be bullish, targeting last week's high of 1.3205.
3. There is some natural support at around 1.30 which looks like a good area to look for longs, should price retrace there before reaching 1.3205 first.
4. There should be a very strong bounce when the price next returns to around 1.2902, perhaps even a few pips above that. The sooner the price reaches this level, the stronger the bullish bounce is likely to be.
5. Should the price move upwards early this week then reverse suddenly above 1.31 to fall, a short down to about 1.3020 might be in order.


