In my analysis of GBP/USD last Thursday 11th July, I predicted that we could be cautiously bullish, but that the price needed to close the week above 1.5207, as we had been in a strong down trend and were currently located in a zone of bearish price action. I also stated that it was hard to accurately predict any good levels at which it would be profitable to look for trades.
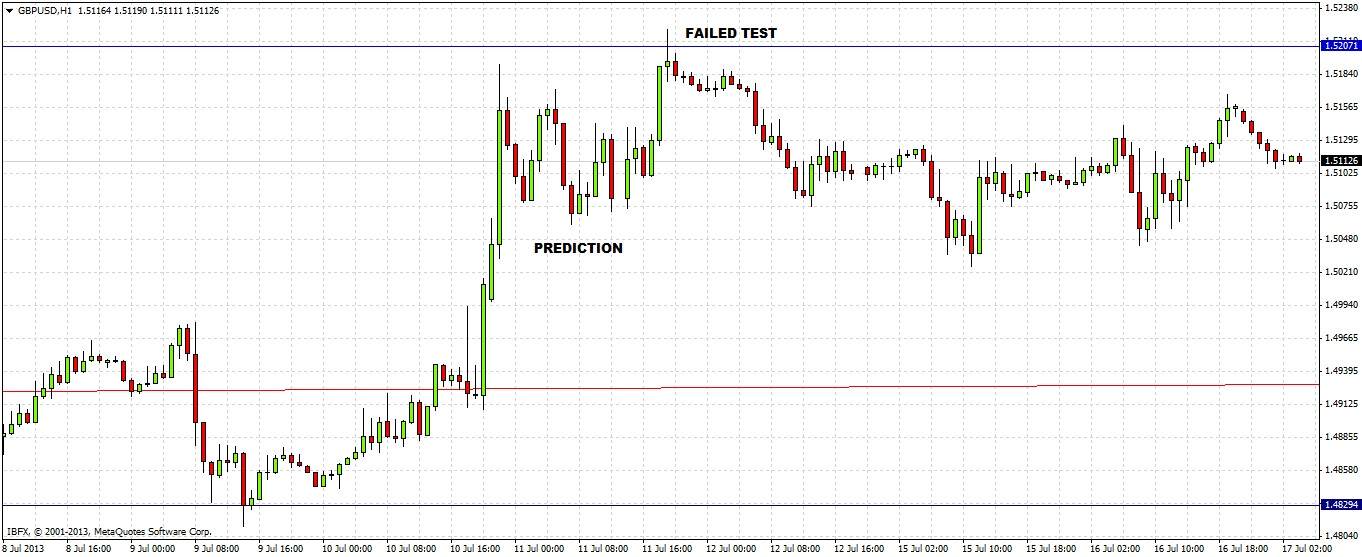
This turned out to be an accurate forecast, as the week actually closed at 1.5102, well below 1.5207, and the action has been somewhat bearish ever since. The price actually tested 1.5207 during the late New York session on the day of my previous forecast, and failed decisively:
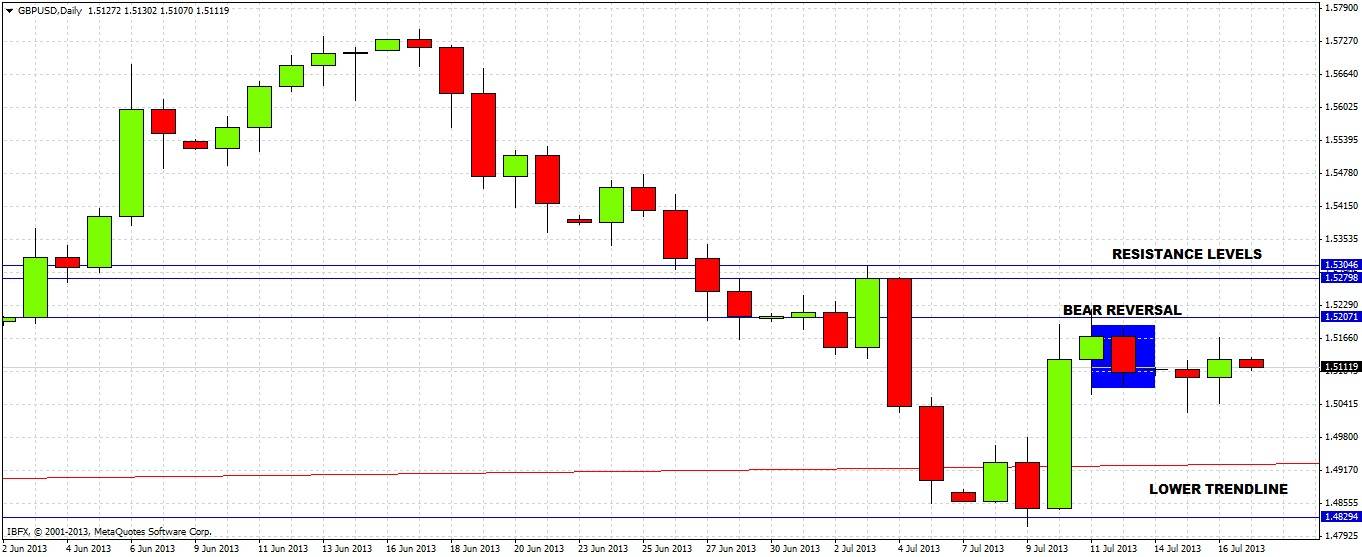
The action has been generally quiet. Neither the monthly nor the weekly charts reveal anything new since last Thursday, we have to drill down to the daily chart to find something interesting: a bearish reversal last Friday that came off the previous day's rejection of 1.5207:
This indicates that the price is likely to fall as far as the lower trendline of the long-term triangle at around 1.4929 before it hits 1.5207 again, as long as there are no bullish daily reversals in the meantime. However the first two days of this week show long lower wicks, so we need to add caution to our bearishness.
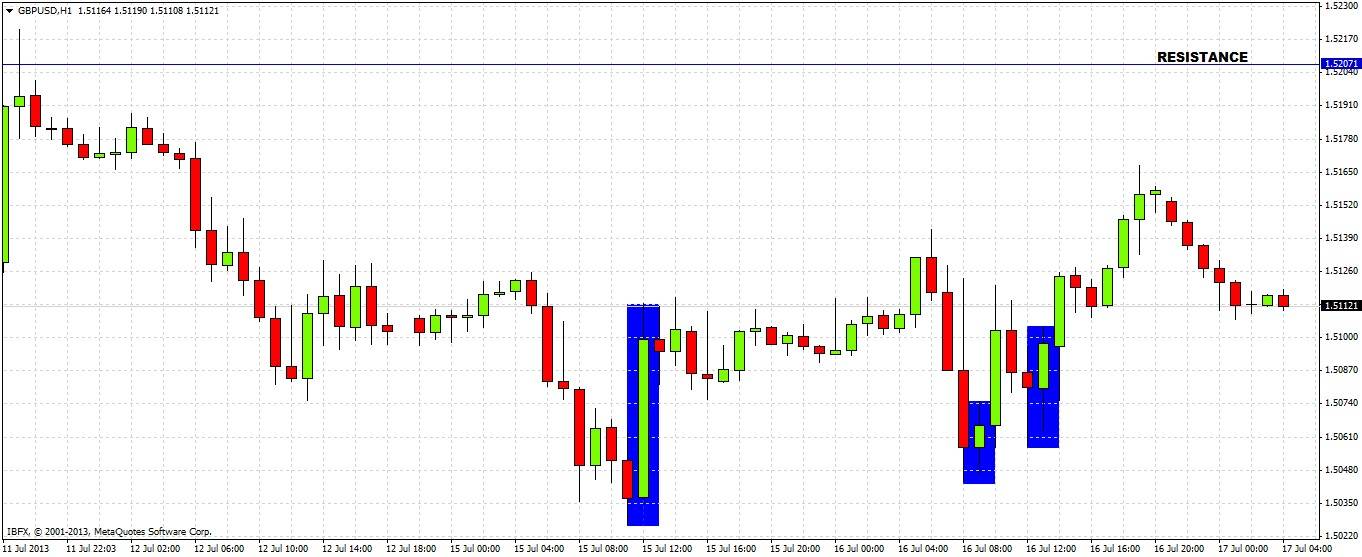
Dropping down still further to the hourly chart, we can see exactly where the buying is:
So far we are getting support at between 1.5025 and 1.5100. We are going to need some proven downwards momentum before turning comfortably bearish.
My bias for the coming days is in theory very slightly bearish but effectively neutral, GBP/USD just simply does not look like a worthwhile pair to be trading right now until something more dramatic happens. This could be a stronger reversal off 1.5207, or a break of this week's low at 1.5026 with some momentum. As things stand, this pair looks like a waste of time for directional trading.


