
The monthly chart shows this pair in a weak uptrend that has strengthened since the summer of 2012. There is a resistance zone overhead:
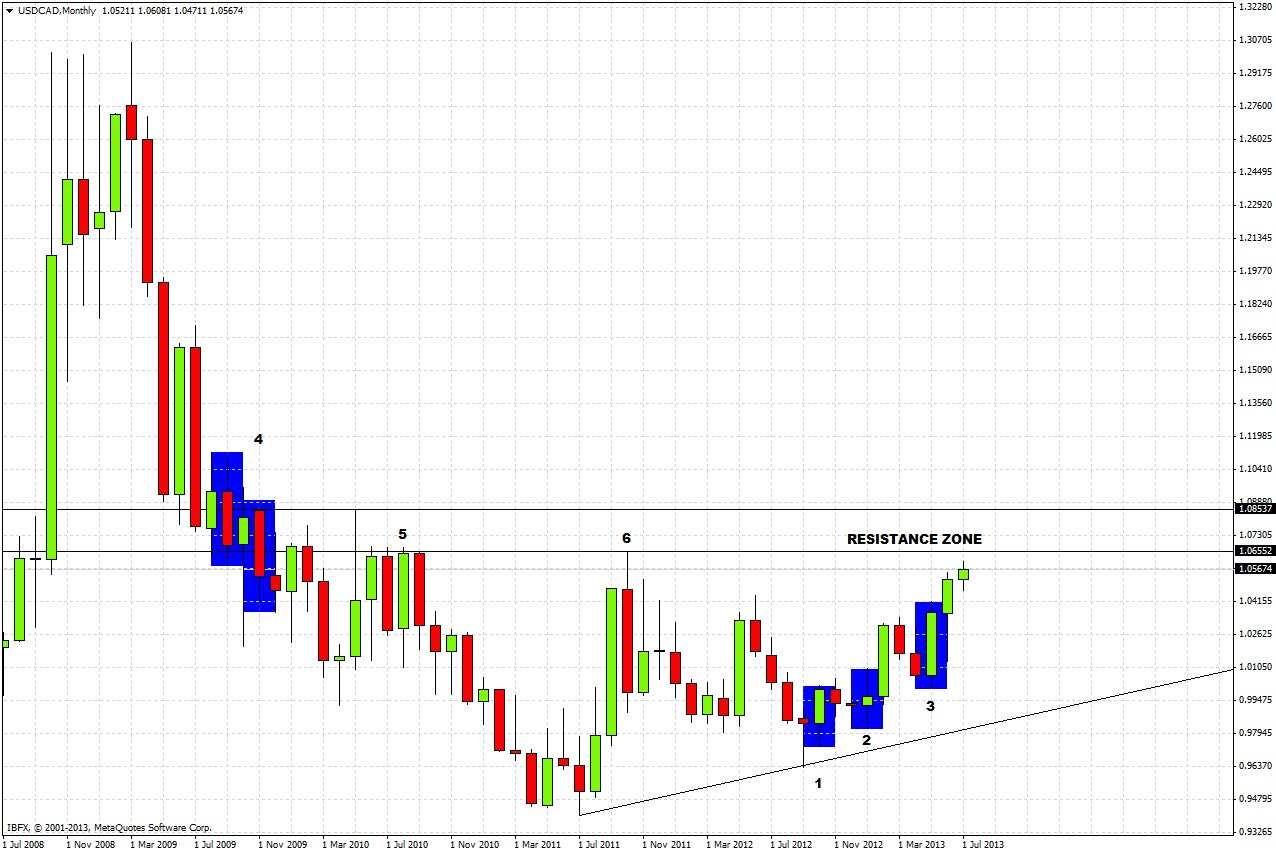
1. A supporting lower trend line was established by a spinning bottom followed by a bullish reversal in October 2012.
2. A spinning and bullish reversal formed in January 2013, pushing the price higher.
3. May 2013 saw a strong bullish reversal. Recent months have seen only weakly bearish bars.
There is a zone of strong resistance overhead between 1.0655 and 1.0854. This zone has been very well established by:
4. Bearish price action between September and November 2009;
5. Several failed retests from May to September 2010;
6. A failed retest in October 2011.
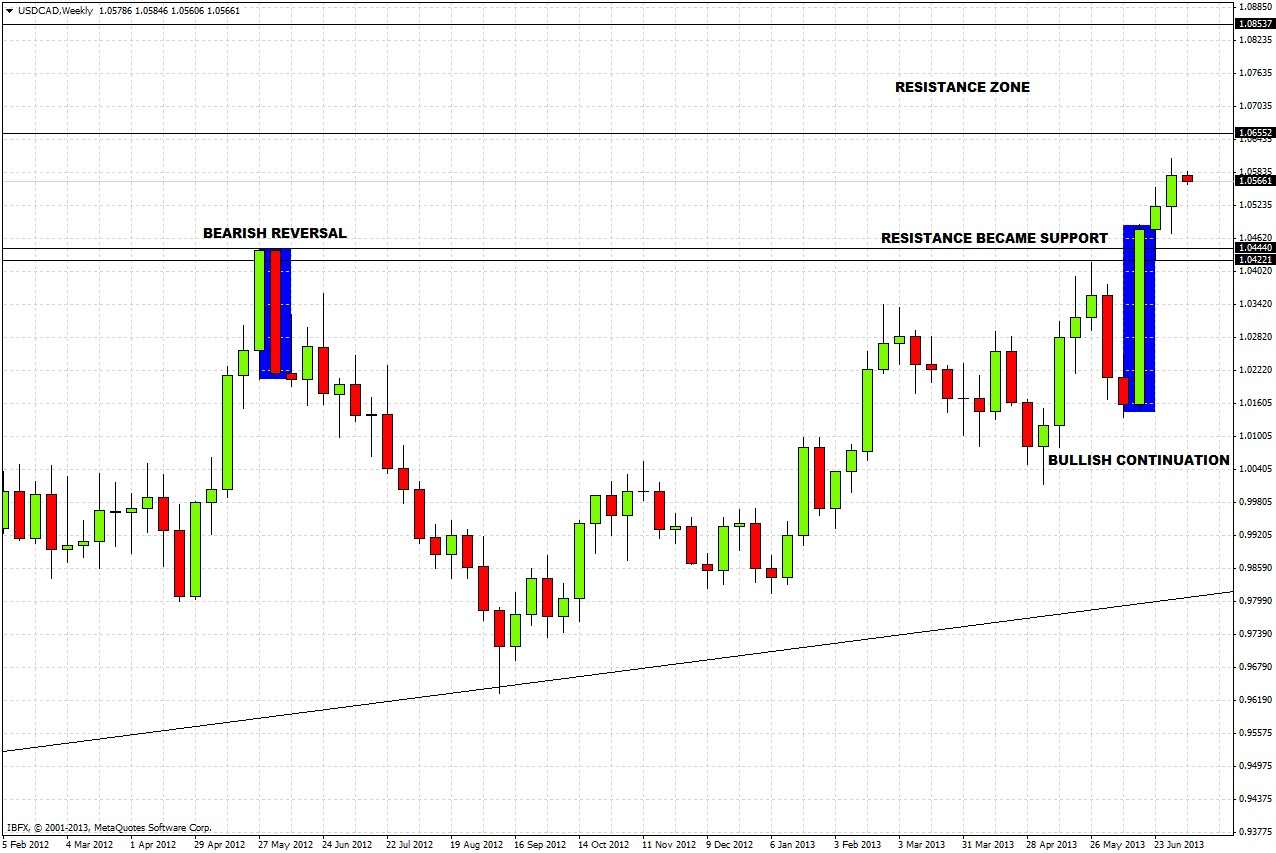
The weekly chart shows the uptrend strengthening, with a bullish continuation bar three weeks ago that took out the two previous bearish bars in addition to the former resistance at 1.0444:
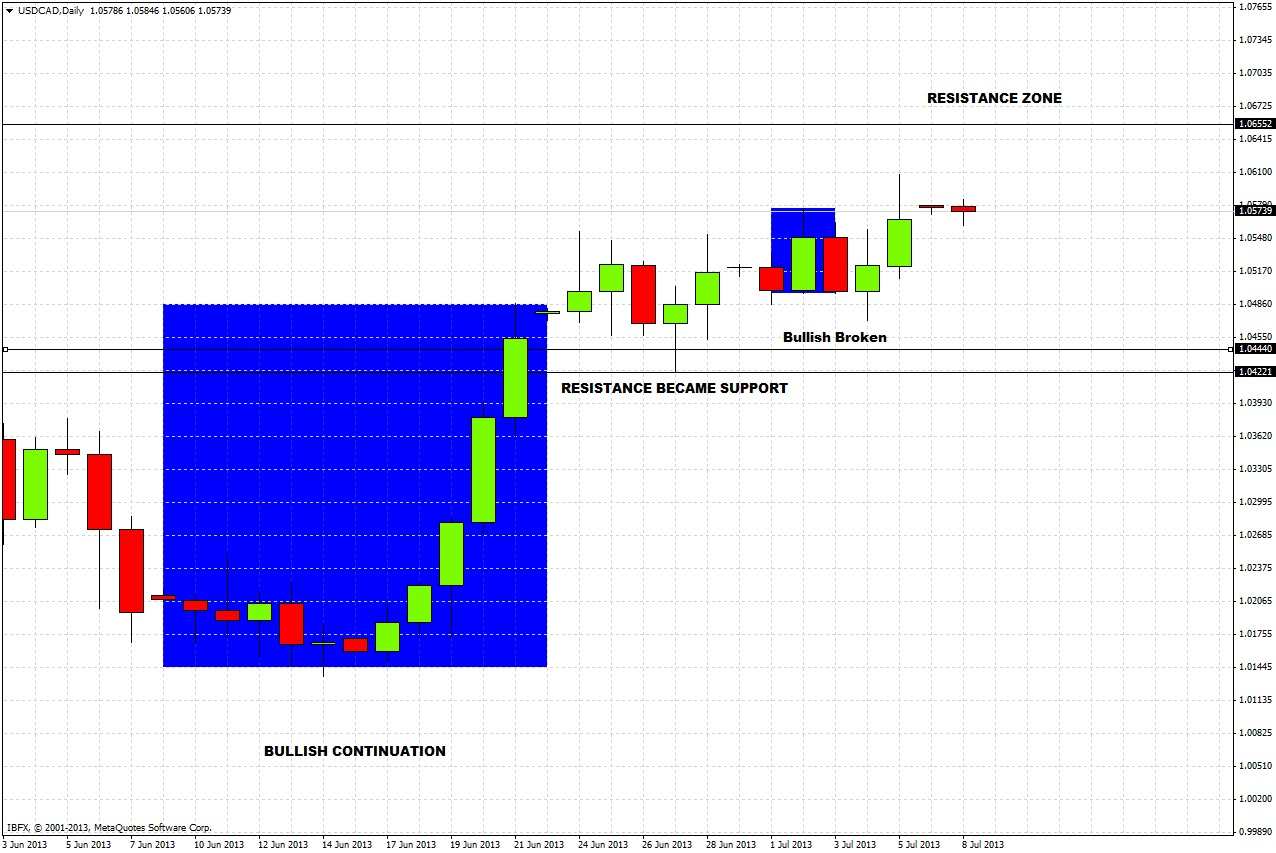
The daily chart shows more clearly how the resistance that was decisively broken on 21st June was tested from above and held on 27th June, becoming support. Despite the upward drift since then, the action has become unclear as the bullish continuation on 2nd July was broken to the downside.
USD/CAD tends to be one of the more difficult pairs to predict technically. Nevertheless some clear conclusions can be drawn:
1. There is significant overhead resistance beginning at around 1.0650.
2. There is support below between about 1.0450 until 1.0420.
3. Action is tending towards the upside, but looks a little choppy right now, especially considering the general strength of the USD.
The rest of this week will hopefully provide a clearer picture. If the price reaches 1.0450 first, we can expect a good bounce up provided 1.0420 is not breached meaningfully. Alternatively, if the price reaches 1.0650 first, this could be an excellent opportunity to short any reversals around or above this level and sit tight until at least 1.0450, retaining some of the position for longer-term targets below.