Since about one and a half weeks ago, I have been forecasting that:
This pair is in the balance, and what happens next should provide a good clue as to whether we are going up to 1.37 or down back to 1.31 and below. If we get a daily close above the trend line we are going back up to at least 1.34. If we get a daily close above 1.34, we are going up to around 1.37.
On the other hand, a daily close below 1.3322 is a bearish sign, and a daily close below 1.3245 will signify a move down to 1.3165 at least.
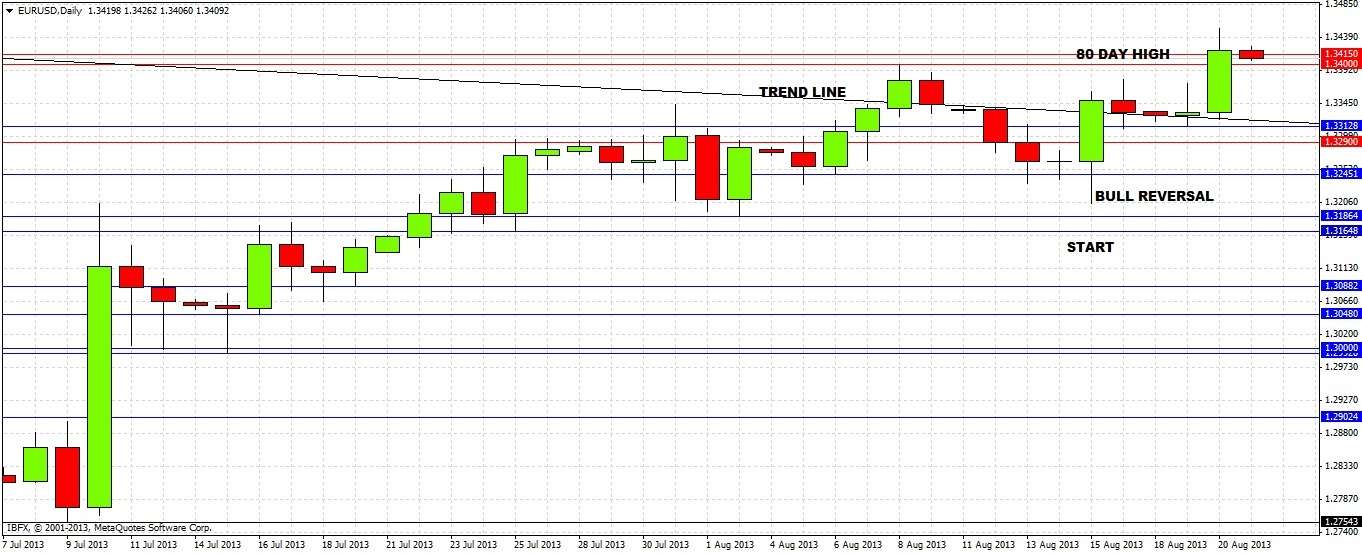
Yesterday we finally did get a strong close above the trend line (see the chart below). In fact, the price has not really closed below the trend line since my last analysis. The close was already above 1.34, so there is not much of a prediction left, except to say that we are going up to 1.37.

The higher time frame charts do not have anything new to tell us yet, all the relevant developments have occurred in the daily chart shown above.
There are several important bullish signs:
1. We finally broke decisively through the upper trend line that has been established since 2011. This is very significant as EUR bears have been pointing to a series of broken lower trend lines over recent years to justify their long-term downward bias. Now, the opposite event has finally occurred.
2. Since the daily bull reversal candle on 15 August, you can see that the broken trend line has acted as support, with no daily or weekly close occurring below it.
3. Yesterday EURUSD broke its 80 day high of 1.3415, and in fact closed just above this level last night. The highest level since last February was reached. The 80 day high is significant to traders as the best turtle/donchian style long-term trading results with EURUSD have been achieved by going long/short at the break of 80 day highs/lows.
4. The break of the 80 day high has happened at the same time as the decisive upwards break of the trend line.
5. We have not had a bearish daily reversal for over two weeks.
6. The weekly chart (not shown) is currently forming a bullish reversal candle, and will close that way unless a sharp downwards move happens later this week.
7. In a relative strength analysis, the EUR has been the strongest of all the world's currencies over the past month.
So, are there any reasons to be cautious? It is always possible to find reasons, but here the bullish momentum is unarguable. The only problem is that there is a very strong resistance levels ahead of us at 1.35 (which is also the 50% fibonacci retracement of the downwards move since 2011) which when last tested produced a spectacular downwards move. The area between 1.3650 and 1.3710 is a major swing high within a down trend and could also be strong resistance.
The key thing to watch for is whether the price is supported by 1.34, which could be a great level to take longs. If we get a close above 1.3415 today that is a strong sign for continued bullish momentum. If not, we might bubble along for a while before continuing the upwards move. Unless there is some significant news though, I cannot see a sharp move downwards now.
We are heading for 1.35 next and quite probably 1.37, and 1.35 would be an excellent place to take profit or tighten stops on any existing longs. Quite probably the price will take a few more days to break through that key level.

