My piece last Monday ended with the following recommendation:
This pair is very bullish right now and is actually the key pair in focus within the forex market, so it is definitely worth keeping an eye on further long opportunities. I recommend exiting at least part of any long position at 1.5750 which should prove to be strong resistance before eventually breaking to the upside.
Since then, none of the areas I mentioned as levels of potential support were hit, nor did the price reach 1.5750 yet. I was correct in my bullish bias though, at least until yesterday evening.
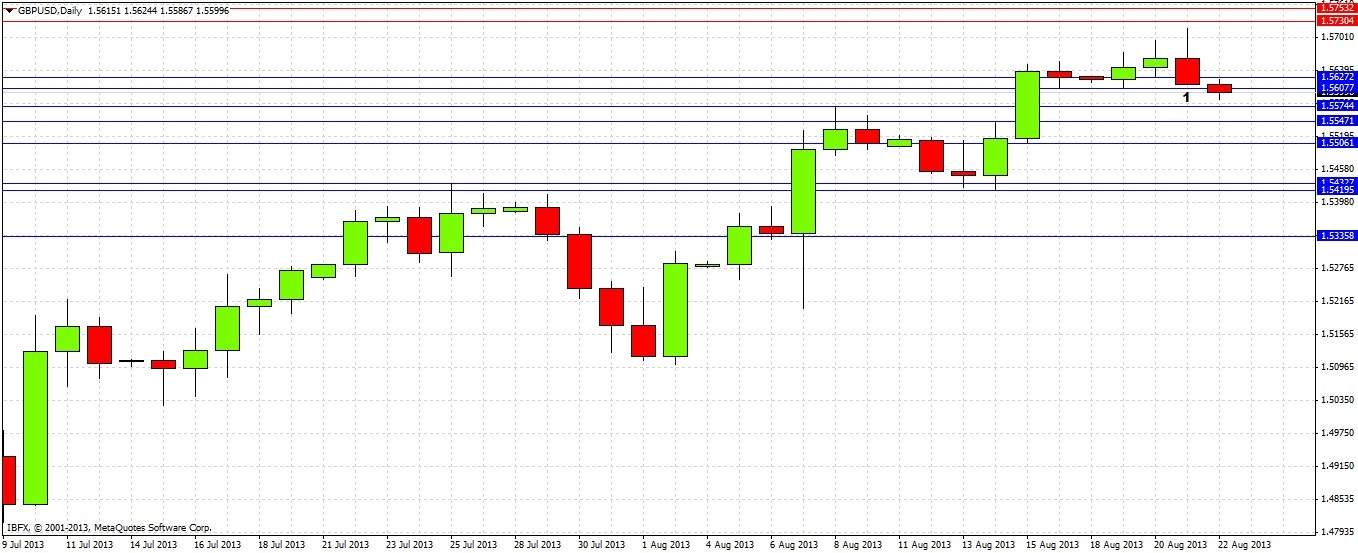
Looking to the future now, let's take a look at the daily chart, and the very bearish candle that was printed yesterday marked 1:

This candle did not only close below yesterday's open, it also closed below yesterday's low, making it an outside bearish reversal. Its upper wick is also longer than its real body, which is another bearish indication. Its low was already broken overnight. The upper wick of the candle is positioned close to the strong overhead resistance at 1.5730-50. All these factors suggest that we will see a move down to last week's low of 1.5422 before we will breach yesterday's high of 1.5717. So on the face of it, it seems like we have a good opportunity here for short trades.
The problem with this scenario is that we have seen a lot of bullish momentum lately, so we can expect support to kick in at certain levels. The question really is whether yesterday's flow of money into USD is a real sentiment change, or just a temporary reaction to last night's release of the FOMC minutes. The USD is showing strength across the board right now. Other factors suggesting GBP bearishness are that GBPJPY bounced off its upper triangle trend line yesterday, and the GBP is showing some weakness right across the board, though not as strongly as the USD is strong.
If we continue our move down, we can expect initial support to kick in somewhere close to 1.5506, one of the key recent daily lows.
We will be able to get more precise clues about any move down from the hourly chart below:

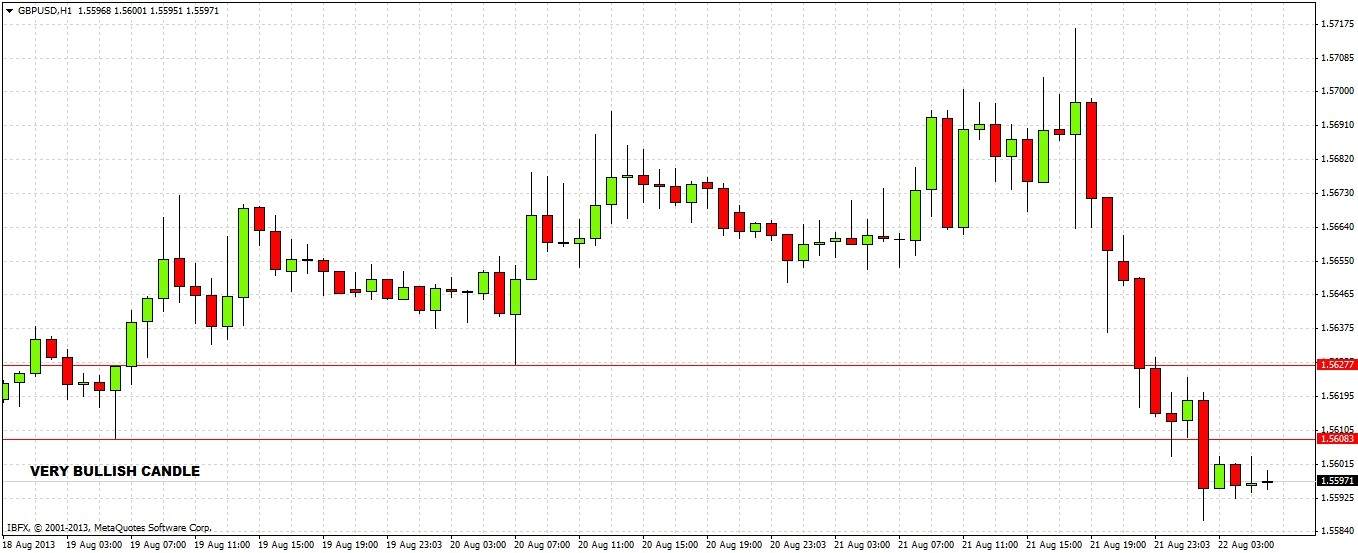
Notice how the low of the very bullish candle on the left was broken a few hours ago. There was significant buying at this level earlier this week, and its low at 1.5608 broke quite easily, which is a bearish sign. Yesterday's low at 1.5628 also broke easily. The first indication we might see as to how things are going to go now will be whether these two lines will start to act as overhead resistance, checking any move back up.
If these lines hold this morning, we can expect to see a continued move down to around 1.5506. There would probably then be a continuation move down after some kind of bounce up. If these lines are broken to the upside today, we might get another test of yesterday's high, possibly providing a great opportunity for a short. Being short right now with a stop just above yesterday's high looks like a good trade if you can accommodate a stop loss in excess of a hundred pips and sit tight.
I am usually wary of turning bearish when there has been such strong bullish momentum so recently. However this pair can turn very quickly, unlike the EURUSD, which usually needs a few days to turn around. If you do go short, be cautious at the blue support levels, especially 1.5506.

