It has been almost three weeks since my last day-to-day technical analysis of this pair. My predictions then were as follows:
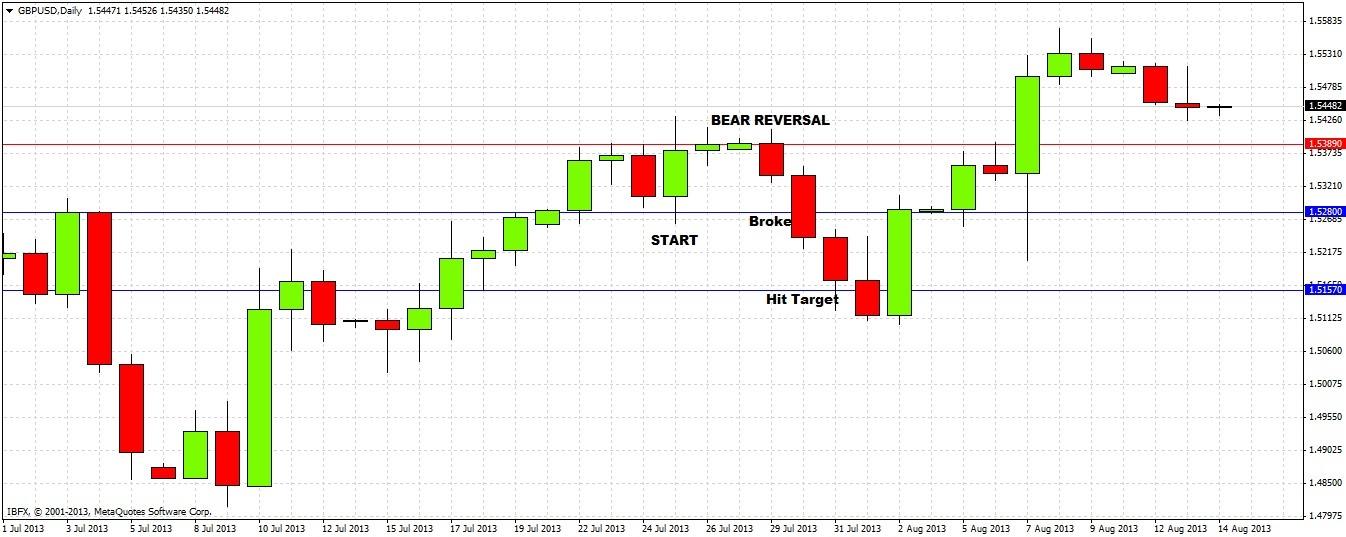
1. If the price breaks decisively downwards through the support at 1.5280 – the sooner the better, preferably today – we should turn bearish and target a fall down to about 1.5157.
2. If the high of yesterday's bearish reversal at 1.5389 is decisively broken to the upside – and again, the sooner the better, preferably today – we should resume our bullishness and expect to see 1.5478.
I'll say something about this week's close. If it is above 1.5305, that is a bullish sign for next week. If the close is below 1.5280, conversely, that will be bearish.
My first prediction was spot on. The daily chart below shows that although the on very same day of my analysis we had a bullish reversal candle, the price was held firm by resistance at 1.5389, and it fell and broke 1.5280 and reached 1.5157 quite quickly.

However my second prediction about the weekly close was wrong, despite the week closing very bullishly near its high and above 1.5305, it did not really break the high of that daily bearish reversal at 1.5389. The lesson here is that reversals on lower time frames can provide a warning that the signal from a higher time frame is becoming invalid.
Looking to the future now, we are well within the long-term narrowing triangle, so we have no direction from any trend lines.
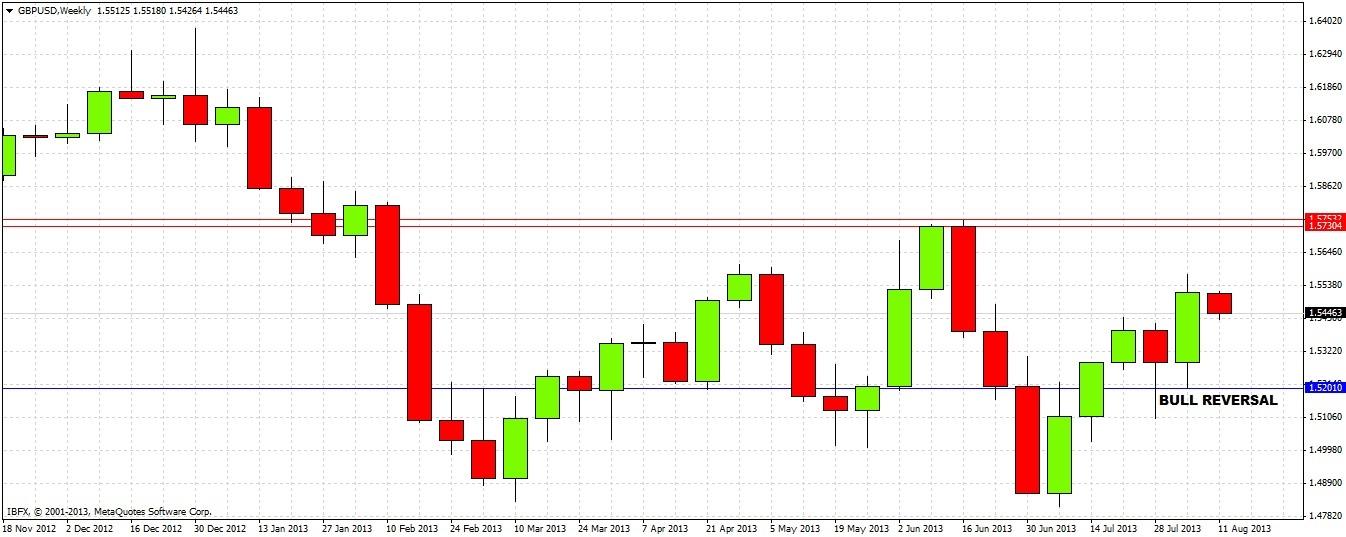
Starting with the weekly chart below, we can see that last week we had a bullish candle, reversing the previous week's bearish candle. This suggests support below at 1.52 and that we are first going to reach resistance overhead at 1.5730. However, this picture is weakened by the fact that it is Wednesday and we have show no sign yet this week of challenging last week's high:

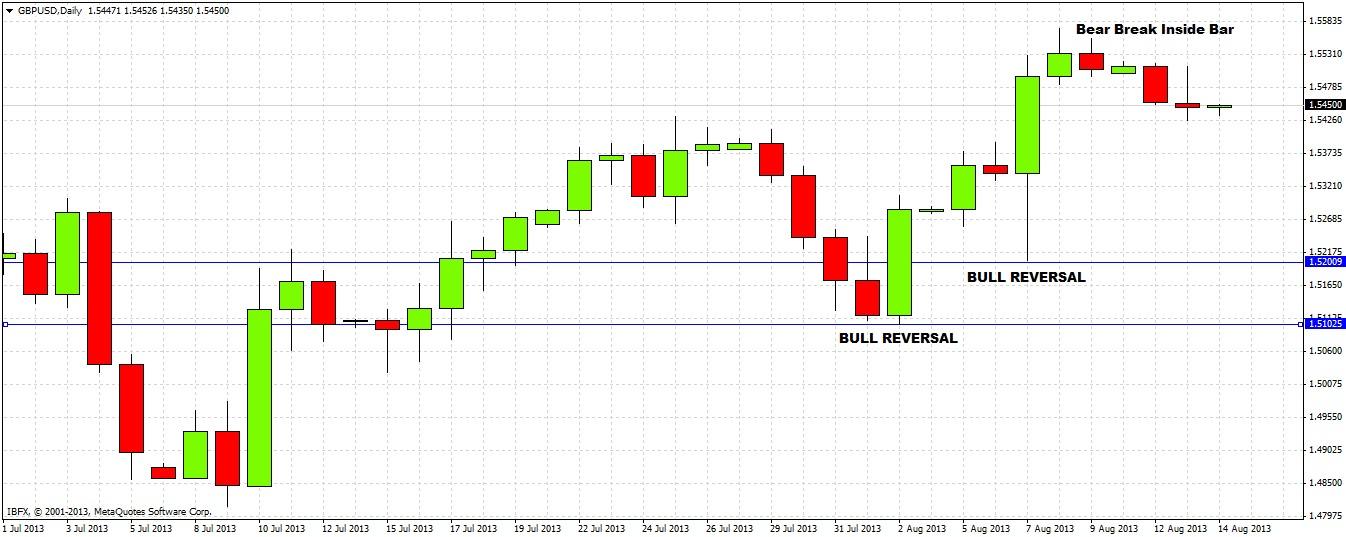
The daily chart does not tell us an awful lot more, except that we had two recent bullish reversals, including one last week that was an extremely strong bullish day, following policy declarations from the Bank of England. Since then we have seen bullish momentum die off, but not really become properly bearish:

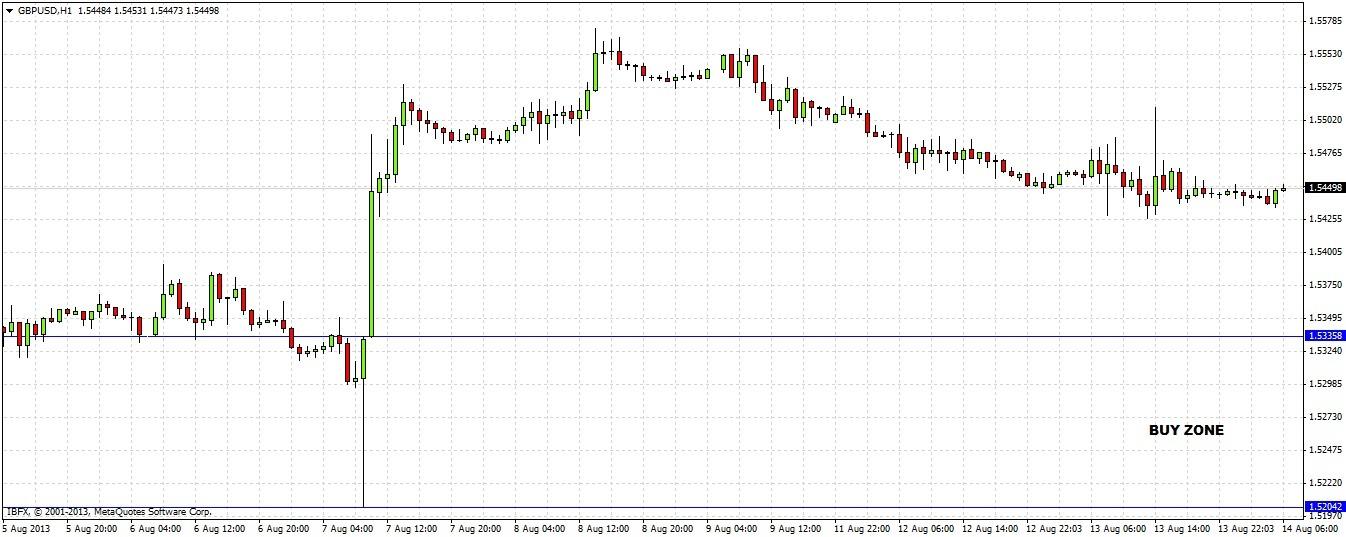
So the picture is still bullish, but we need to drop down to the 1 hour chart to see the key decisive point:

We can see in the above chart that the day of the last bullish reversal printed an extremely strong bullish pin candle on the 1 hour chart. We are already in the zone of the bullish daily reversal, so it looks like we are only likely to get the bullish momentum starting again when we get down to this very large buy zone between 1.5204 and 1.5335, or at least closer to it.
Unfortunately this is an extremely wide zone, but if we reach 1.5335 that will undoubtedly be a good place to look for longs. If we break 1.52 at all then we can look for shorts down to 1.51. There is resistance overhead at 1.5730.

