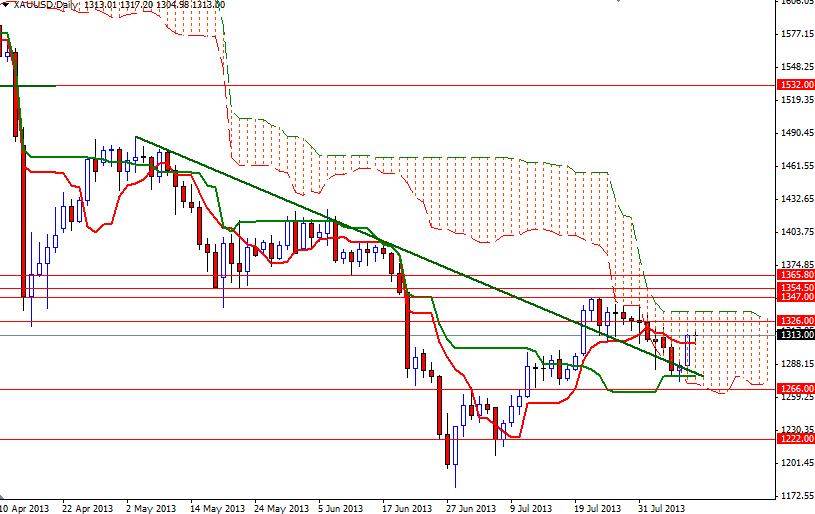
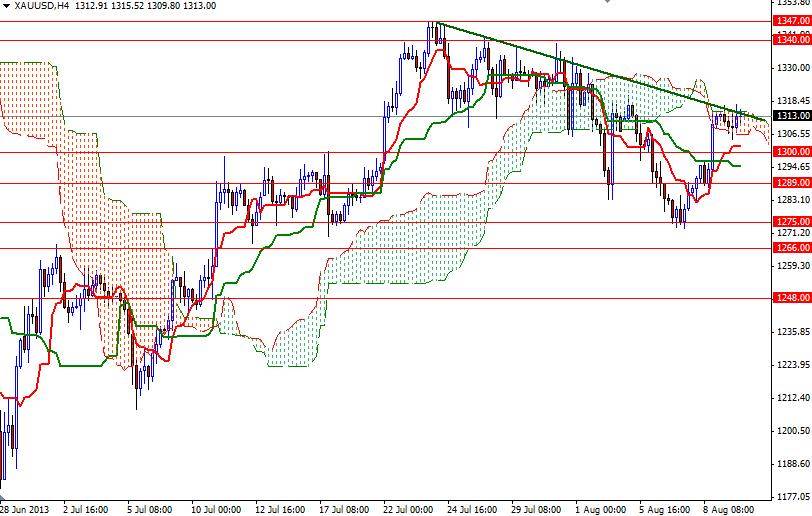
The XAU/USD pair ended the week slightly higher after bouncing off of the 1275 level where the Kijun-sen line (twenty six-day moving average, green line) resided on the daily time frame. The pair traded as high as 1317.20 on strong Chinese economic data and weak demand for the American dollar. Data out of China, the world's second-biggest gold consumers, showed the country’s exports rose 5.1% and industrial output climbed 9.7% in July. The data which came out well above expectations eased worries about Chinese growth. Recent reports suggest that Asia remains the key driver of gold demand. According to Commerzbank, China continued to take advantage of falling prices and imported 104.6 tons of gold. It seems that the bullish mood in the commodity market is helping gold to hold above the descending trend line which we can see on the daily chart. Friday's data from the Commodity Futures Trading Commission (CFTC) show that speculative investors increased their net-long position in gold to 51635 contracts, from 28366 a week earlier. Technically speaking, I expect to see prices climbing towards the 1334.07 if the XAU/USD pair manages to climb above the short-term descending line which intersects with the top of the Ichimoku cloud on the 4-hour chart. On its way up, expect to see resistance at 1326. A daily close above 1334.07 would suggest that 1347 and 1354 might be next. If the bears increase the downward pressure and pull the pair below 1300, I will be looking for 1289 and 1275. Breaking the 1266 support level means we are back below the Ichimoku cloud (daily chart). If that happens, I believe 1248 will be the next stop.
Gold Price Analysis - August 12, 2013
By Alp Kocak
By Alp Kocak
Alp Kocak has been trading Forex since 2003. He writes technical analysis based on Japanese candlesticks and Ichimoku Kinko Hyo.
Subscribe
Sign up to get the latest market updates and free signals directly to your inbox. Please enter a valid email address

By Alp Kocak
Alp Kocak has been trading Forex since 2003. He writes technical analysis based on Japanese candlesticks and Ichimoku Kinko Hyo. - Labels
- Gold


