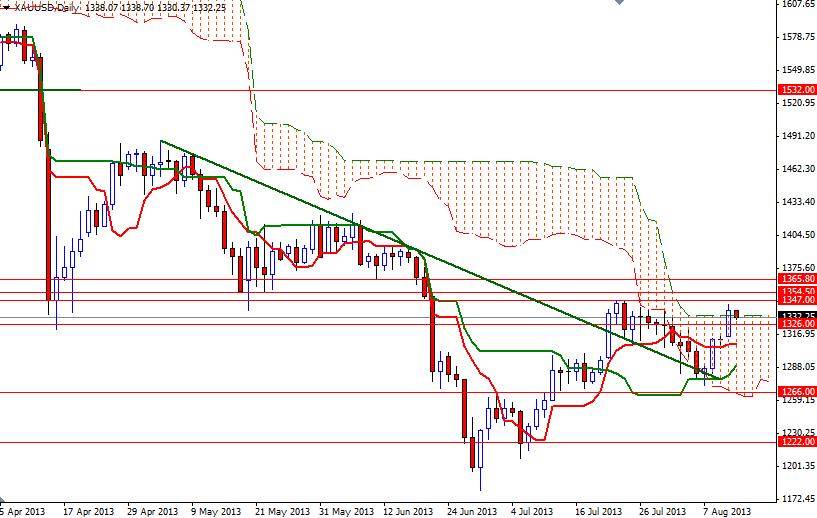
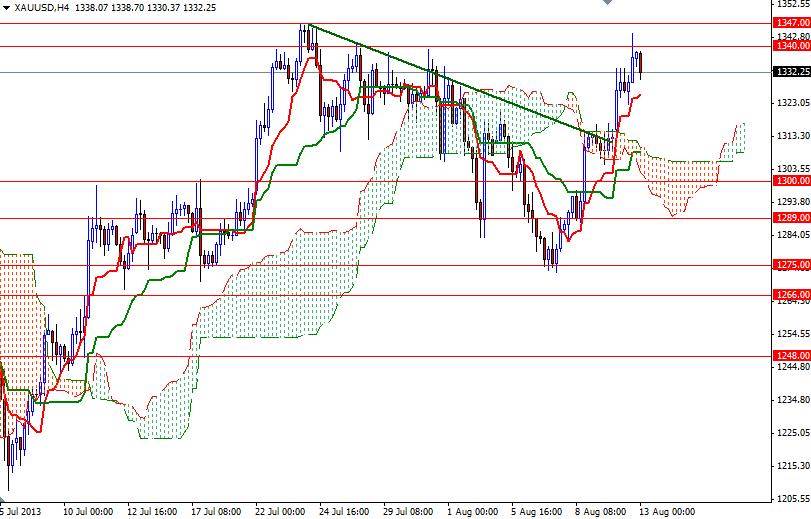
Gold prices settled higher yesterday after the China Gold Association reported that purchases rose 54% in the first half from a year earlier. The XAU/USD pair traded as high as 1344.08 and closed above the Ichimoku clouds on the daily time frame for the first time since October 25. Recent data out of the China -the world's second-biggest gold consumer- fueled optimism the economy is gaining momentum. XAU/USD (Gold vs. the Greenback) has been basically bearish since October 2012 when it 1795.75 on growing expectations that the Federal Reserve will adjust the pace of monthly asset purchases based on improvement in the economic outlook (currently the Fed purchases mortgage-backed securities at a pace of $40 billion per month and longer-term Treasury securities at a pace of $45 billion per month) and it seems that tapering issue is already priced into the gold market.
From a technical point of view, we have bullish Tenkan-sen (nine-period moving average, red line) - Kijun-sen line (twenty six-day moving average, green line) crosses on both the daily and 4-hour chart. In addition, prices are moving above the Ichimoku clouds on the 4-hour time frame. This suggests that the bulls will have advantage while the pair is trading above the 1300 level. However, the long-term technical outlook is still bearish and because of that, the upside may be limited.
Bear in mind that the U.S. retail sales figures will probably be the key focus for some investors today. In order to gain more traction, the bulls will need to break through the 1347 resistance level before challenging the bears at 1354.50 and 1365.80. If the bears successfully defend this level and increase the pressure, expect to see support at 1326, 1314 and 1300. A daily close below 1300 would indicate that the bulls are running out of steam.


