During yesterday’s session, the XAU/USD pair (Gold vs. the American dollar) managed to hold above the 1360 level after HSBC reported that preliminary index of manufacturing activity advanced to 50.1 from 47.7. The flash reading indicates that the world's second biggest economy is in a better shape than analysts had been expecting. Although the pair traded as high as 1381.78, comments from Federal Reserve Bank of Dallas President Richard Fisher limited the shiny metal's gains. Fisher said “I would have liked to start cutting back earlier. The economy is strong enough for slowing purchases”.
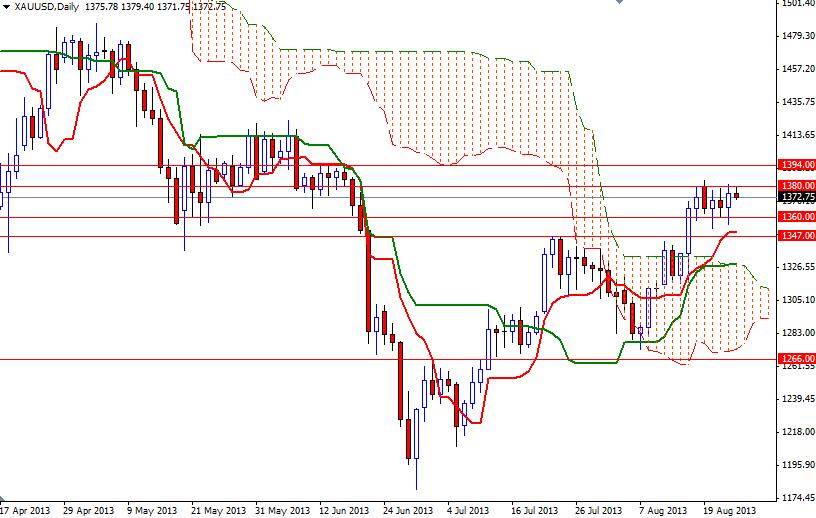
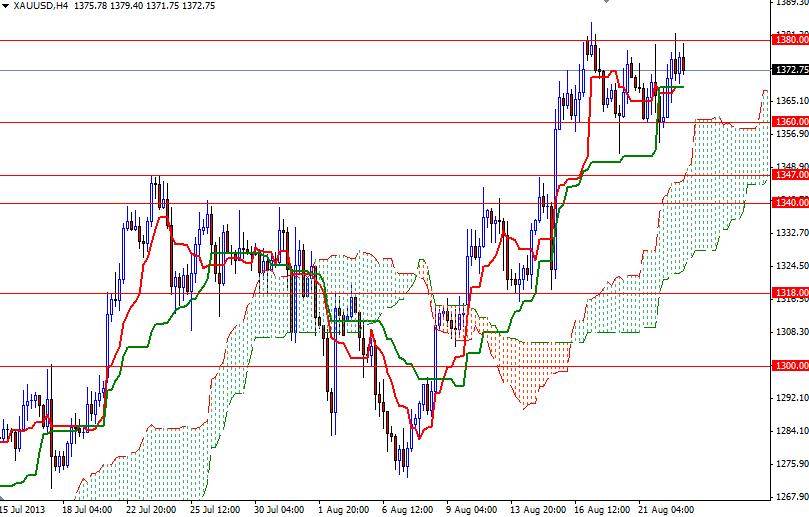
The pattern on the daily chart suggests that neither the bulls nor the bears have enough power to breach current consolidation borders roughly between 1360 and 1380. In the short-term, I think that the price action will be limited until we manage to leave this area completely. However, the daily and 4-hour charts suggest there is a chance we will see the pair trading higher because prices are above the Ichimoku clouds. If the bulls gain enough strength and push the pair above the 1380 resistance level, we may see a bullish attempt towards 1394. A weekly close above this level would make me think that we will probably be testing 1420 - 1425 area which the bears might step up the pressure. If the bulls run out gas and fail to penetrate the first barrier, 1360 will be the key to the downside. If the 1360 support level gives way, there will be support at 1347 and 1340. Closing below 1340 could confirm that prices will head back to 1328 next.