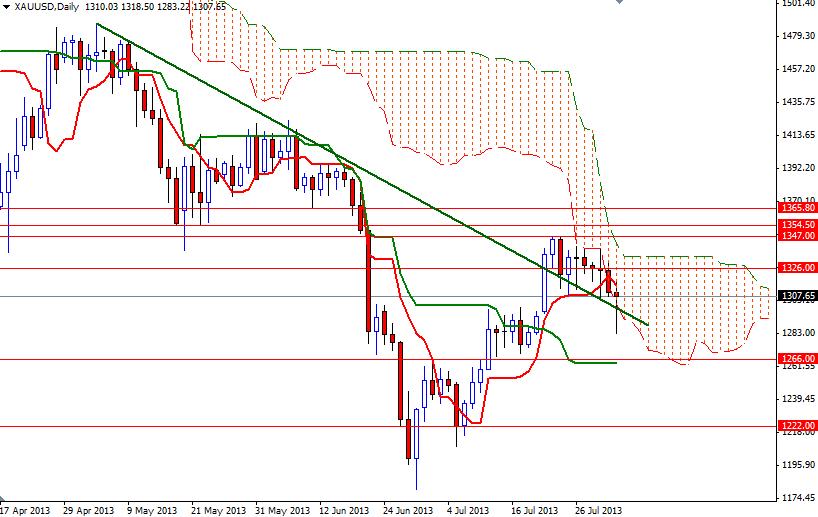
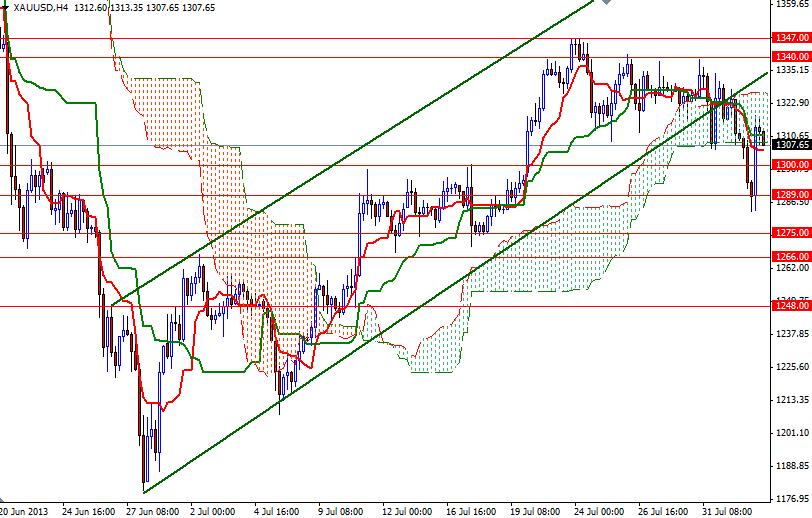
The XAU/USD pair closed the week lower after three consecutive weeks of gains as the Ichimoku cloud on the daily time frame continued to offer some resistance. Although gold prices fell below the 1300 support level during Friday's session, a weaker-than-expected non-farm payrolls report helped gold to recover initial losses and close at 1307.65. Bureau of Labor Statistics reported that payrolls rose by 162000 in July -much less than expectation of 184000- and the jobless rate dropped to 7.4% from 7.6%. I think these figures are not a disaster but still it is obvious that this is not the kind of progress Fed policy makers would like to see. If the market participants believe that tapering is off the table, gold prices will remain supported. However, I think it is too early to announce that the bulls have regained their strength. I believe Monday and Tuesday trading sessions will give us a clear picture about the sentiment. On the daily chart, the XAU/USD pair is still holding above a descending trend-line but the 1340-1347 area has been a cap on the price of gold for the last eight days and as a result we are likely to see the sellers come in and step up the pressure if we approach this barrier. A sustained break above this zone would prolong the bullish momentum and clear the path towards 1365.80. From an intra-day perspective, also bear in mind that there will be hurdles in the way such as 1319 and 1326. If the bulls fail to push the prices above 1326 and the pair starts to fall, again the support zone between 1300 and 1289 will be the key to the downside. Closing below this zone could increase speculative selling pressure. If that is the case, look for 1275 and 1266.