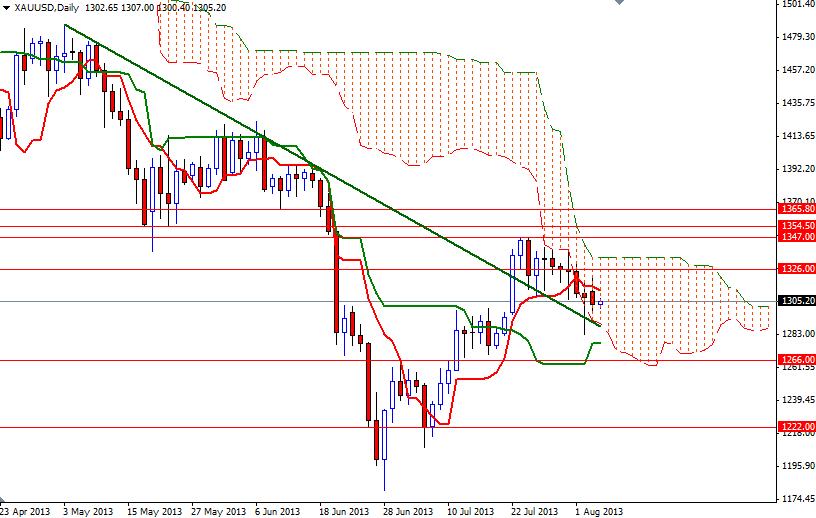
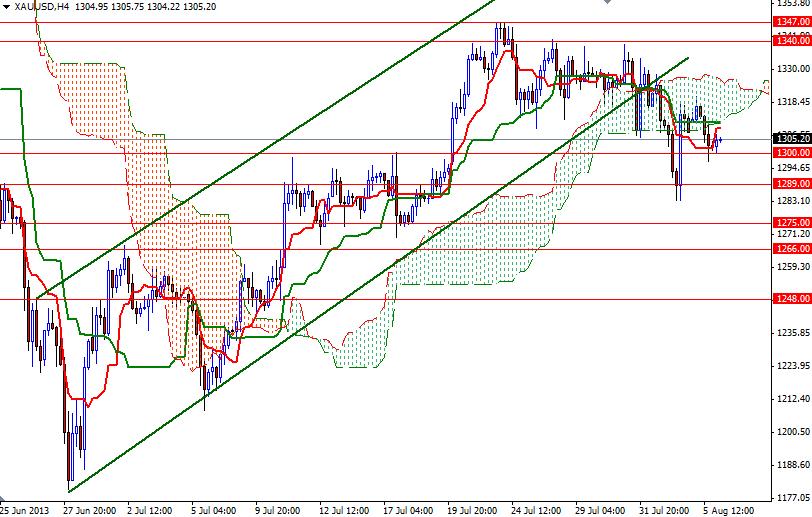
Gold continued to lose ground against the American dollar (XAU/USD) yesterday. Although Friday's disappointing non-farm payrolls report, which stoked speculations that the Federal Reserve will wait for further evidence the labor market and economy are strengthening before tapering asset purchases, helped gold to rebound, the bulls are still struggling to gain traction. According to the report released by the Institute for Supply Management yesterday, service industries in the United States expanded in July (56 vs. 52.2 the prior month). ISM's figures show that the U.S. economy is improving. For now the 1300 level looks supportive but the 4-hour chart is turning bearish as Tenkan-sen line (nine-period moving average, red line) crossed below the Kijun-sen line (twenty six-day moving average, green line). Prices are still trapped in the Ichimoku cloud on the daily chart, indicating that we will see the pair consolidating some more time. If the pair manages to hold above the 1300 level and the bulls increase the upward pressure, we might see another attempt to test yesterday's high of 1320.68. Beyond that point, I expect to see resistance at 1626 and 1334. A daily close above the 1334 level would make me think that the bulls are strong enough to retest last month's high of 1346.62. However, in order to confirm a mid-term bullish trend, I believe that a weekly close above 1347 is essential. If the bears take over and prices fall below the 1300 - 1289 support zone, I think we will be revisiting 1275 and 1266 eventually.