By: DailyForex.com
In my last analysis three and a half weeks ago, I concluded by predicting:
"All the signs point to a continued fall to at least 1.0325, and possibly beyond that. In the chart above I have marked possible support levels at 1.0286, 1.0222, and a strong support zone between 1.0172 to 1.1037 coinciding with the lower weekly bullish trend line. This zone needs to be broken decisively before we can hold a long-term bearish bias."
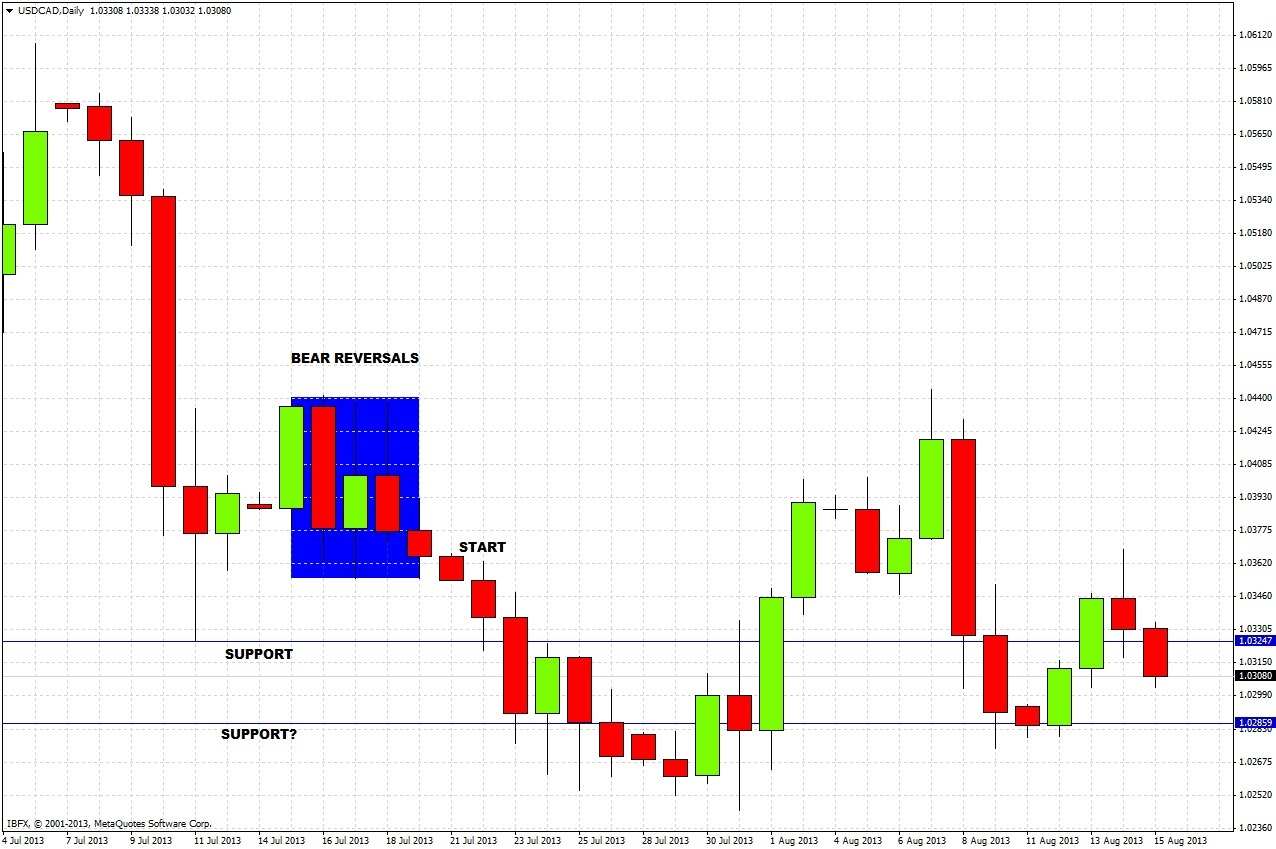
Let's look at the daily chart since then to see how things turned out:
It was a good prediction, later that same day the price fell to 1.0325, and then continued lower for a while after a small bounce. The support zone I identified at 1.0172 was not reached, so the bullish bias was set to continue, and there was then a move up to the zone covered by the highlighted bearish reversals.
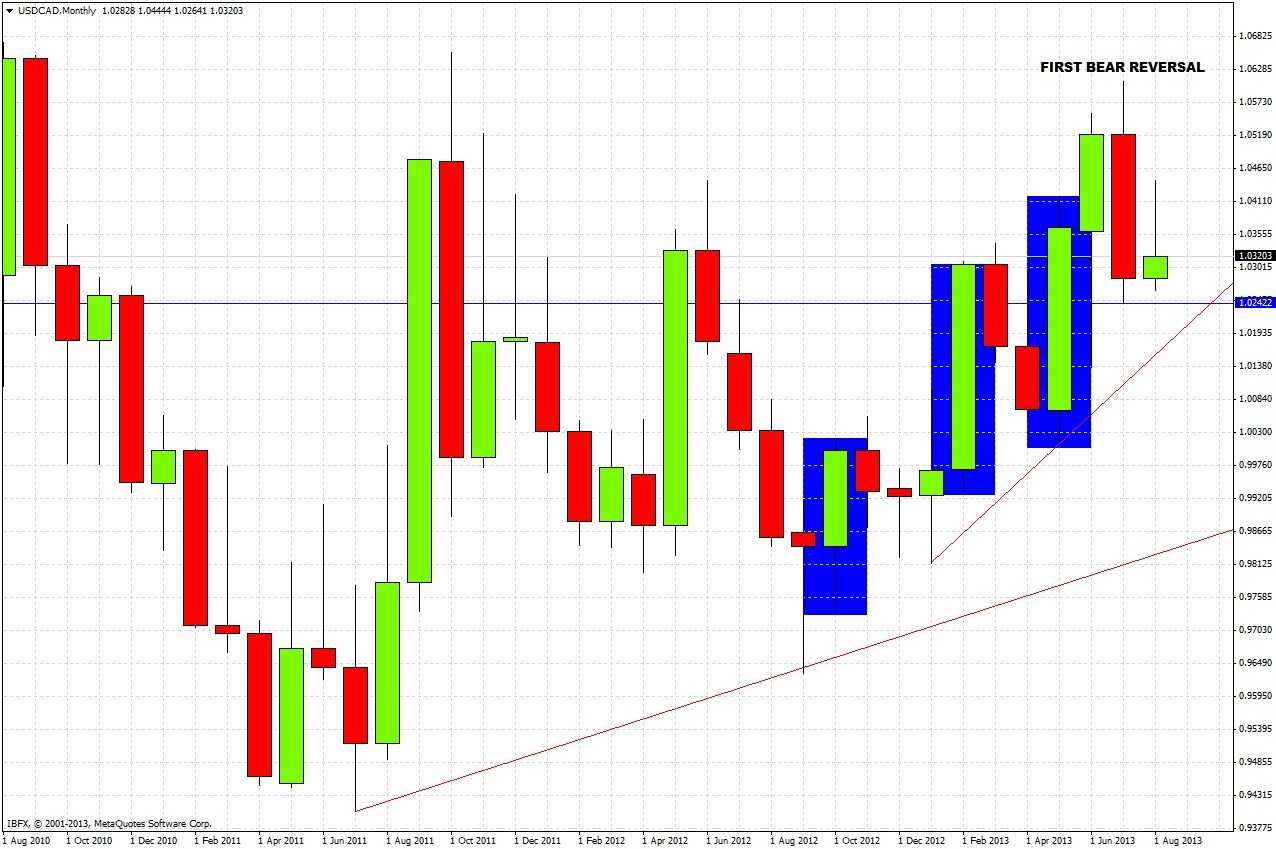
Looking to the future, let's start by zooming out to the longer-term charts, starting with the monthly chart:
The chart shows that for close to a year now an upward trend has held, with two bullish trendlines and three bullish reversal candles (highlighted in blue) that were all broken to the upside by the next candle. However, for the first time in about 1.5 years, there was a bearish reversal candle, and it happened last month. Its low of 1.0244 has not been broken to the downside yet, but the current monthly candle (which is only halfway finished) looks bearish so far. So this long-term chart is showing signs of a new bearish move, but the bullish trend is still intact.
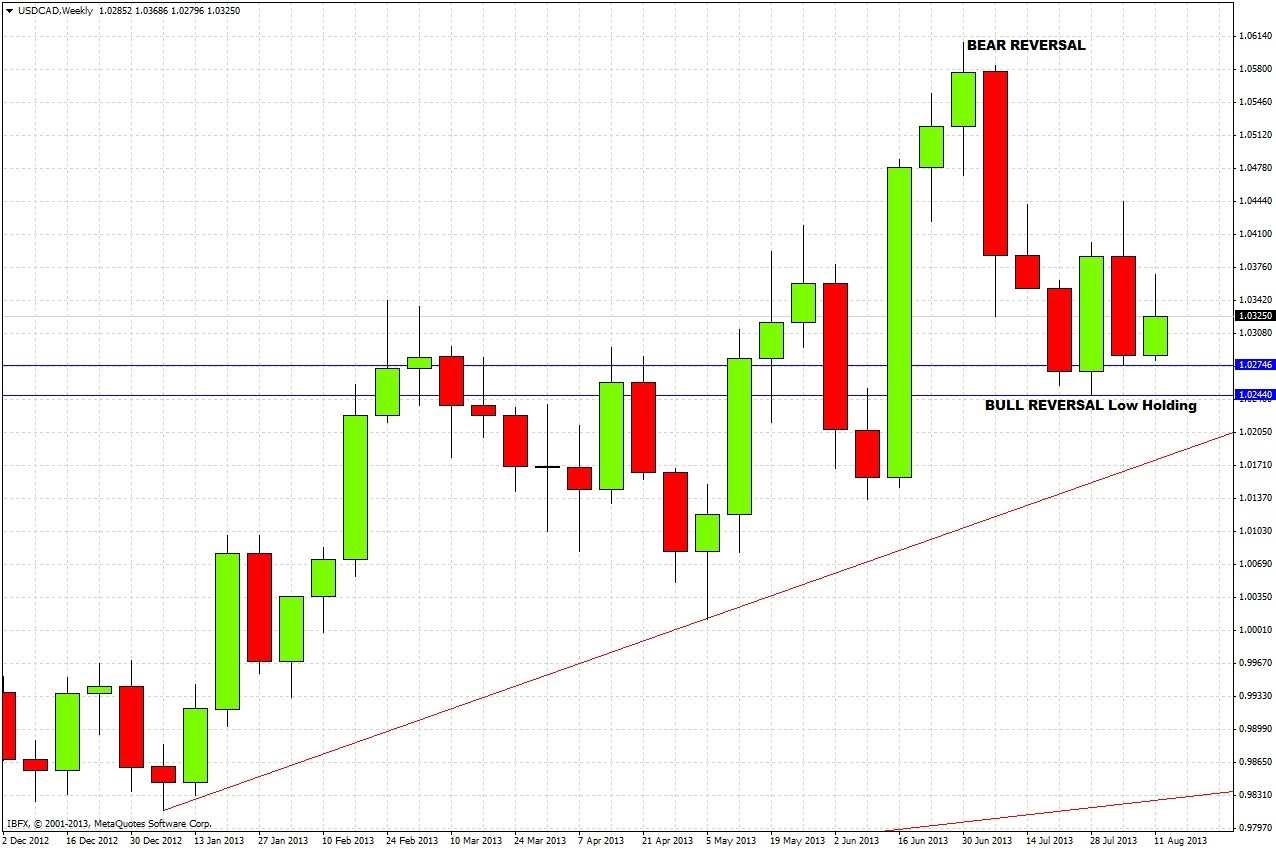
Dropping down to the weekly chart, we see some interesting things:
The monthly bearish reversal also shows up on this weekly chart, but we see that the week before last was a bullish reversal that was immediately broken to the upside! Although price has come down from that high, its low is still intact. This tells us that though we have some heavy downwards pressure, the bullish trend is holding its definition. The good news is that we have from this a key level of 1.0244 to watch – if we get a daily close below that level, it could signify that the bears are in full control. There is also a support line above that at 1.0274 (the low of last week, not so important but something to watch for), then of course the bullish trend line below, which is very important, and then below that the low of the very strong bullish reversal at 1.0147.
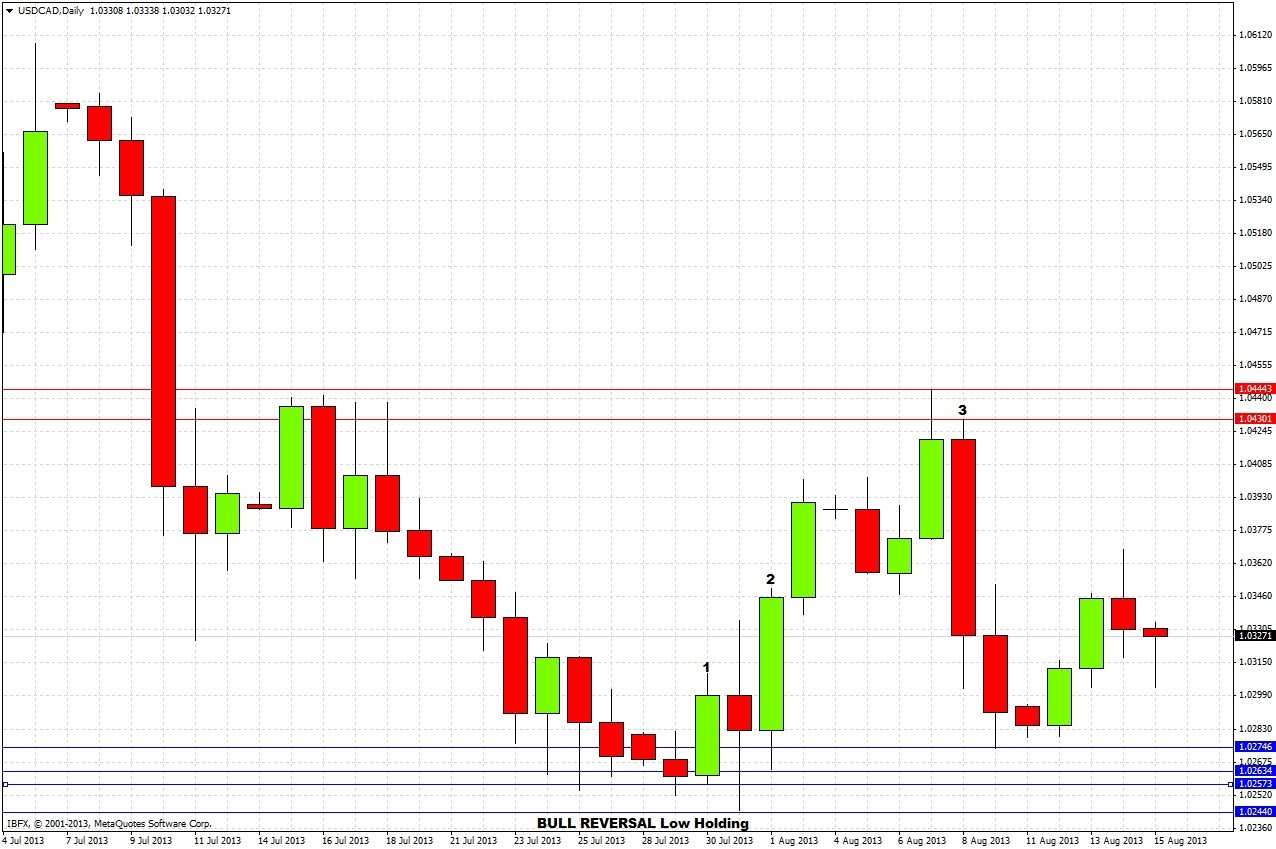
We should be able to get more clarity from the daily chart:
Take note of the following:
1. A bullish reversal candle formed from a support zone, after several failed tests.
2. Another bullish reversal candle, took out the failed retest of the support zone just 2 days later.
3. A very bearish reversal candle., but the move down failed to break the first support line in blue at 1.0274.
In summary, the bullish trend is holding its line, but the momentum of the moment is truly with the bears. The action over recent days has been inconclusive.
What will be key will be whether the zone between 1.0274 and 1.0244 is taken out decisively to the downside. If it is, we can expect to see a test of the bullish trendline. However, if it holds well, we might get some upwards momentum taking us back up to the resistance zone at around 1.0430-43, and if this is broken decisively to the upside then the bulls will be back in full control.
If we not get any dramatic reversal candles, it will be best in the meantime to look for longs off any failed tests of 1.0274, and shorts off any failed tests of the area around 1.0430.


