In my last analysis of this pair almost three weeks ago, I noted that the price was consolidating within a triangle and predicted that:
• 98.50 may be tested again soon and if broken decisively we would see 97.61, which should prove to be stiffer support.
• If this week closes above 101.49, we are likely to see a bullish week next week with a target of 103.72.
For a sign before reaching any of these levels, we should look for a daily close beyond the triangle's trend lines in either direction.
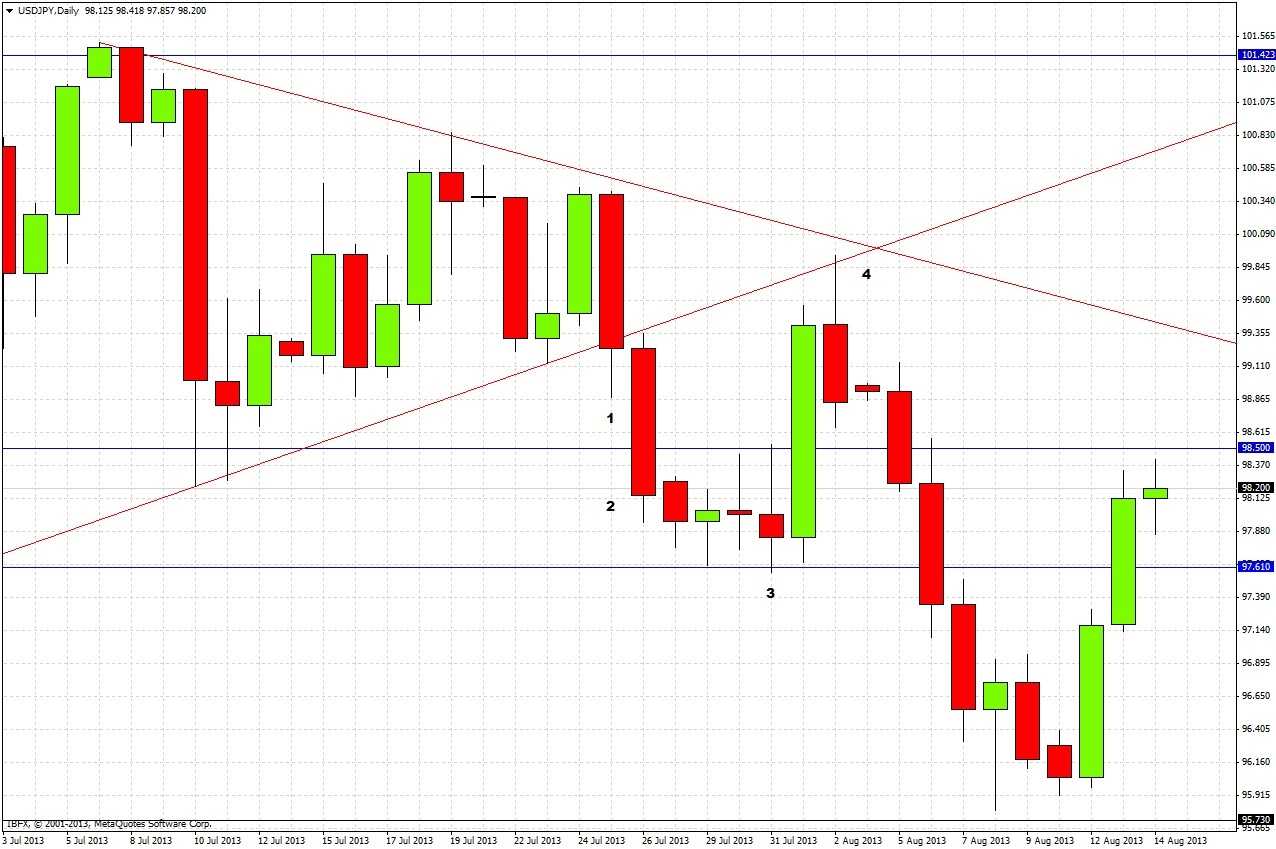
The prediction worked out very well, as we can see from the chart below:

1. The very same day of my analysis, we had a close below the lower trend line of the triangle – a bearish sign.
2. The next day, we had a strong close below 98.50, signifying a move down to 97.61.
3. A few days later we reached 97.61, which acted as excellent support. This was as far as my prediction went, but price then turned around and went up to:
4. Test the lower trend line of the triangle from below, which acted as resistance from which the price fell, though it has recovered strongly from its low during the last two days.
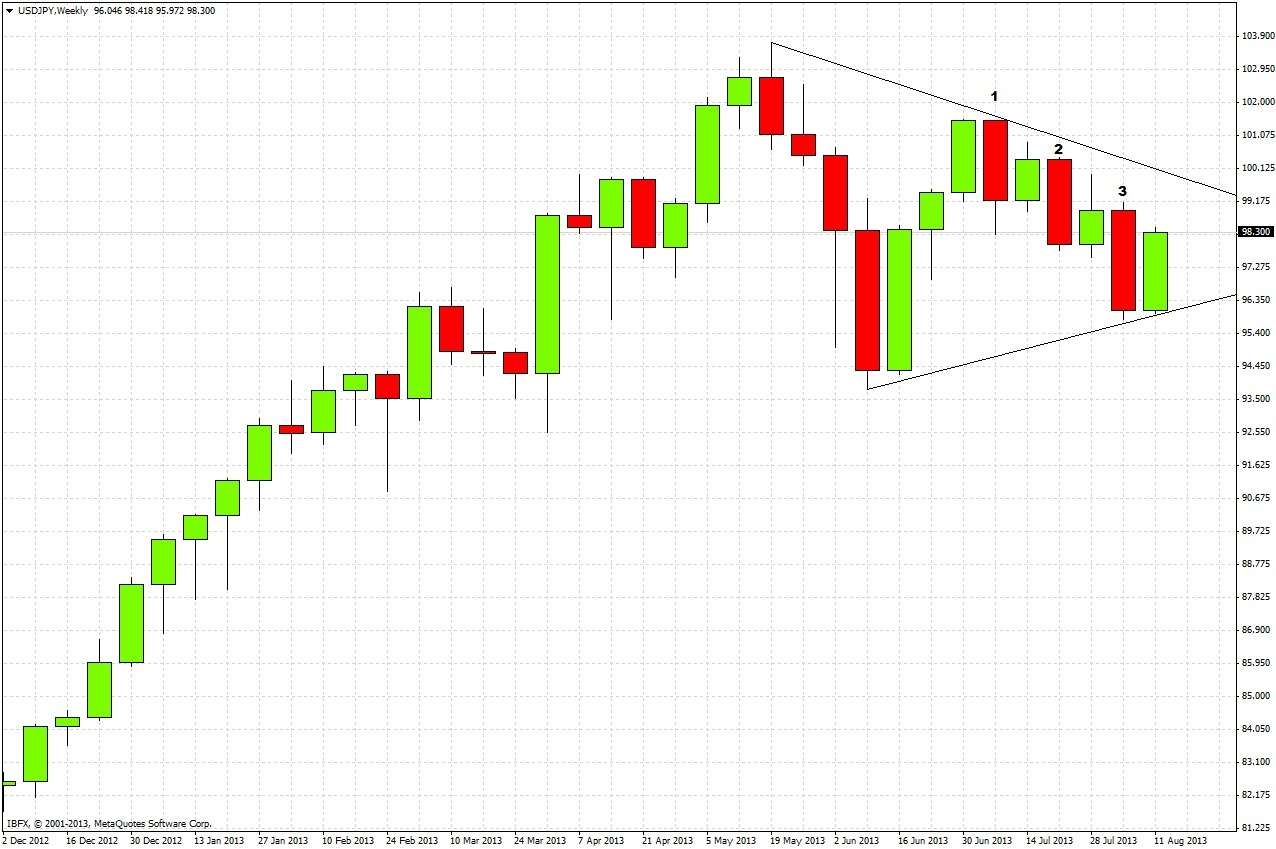
Looking to the future then, we can see by zooming out to a higher time frame that despite the triangle break out on the daily chart, our period of consolidation has not really come to a decisive end. The weekly chart shows a weakly bearish picture
First of all, note that the past three months have formed a consolidating triangle. Secondly, that an interesting pattern has formed over the past weeks: bearish reversal candles at 1, 2, and 3, followed by failure to break the next week after 2 and 3 (which includes last week), and only the narrowest break after 1. This suggests only weak bearishness and re-emphasizes the consolidation.
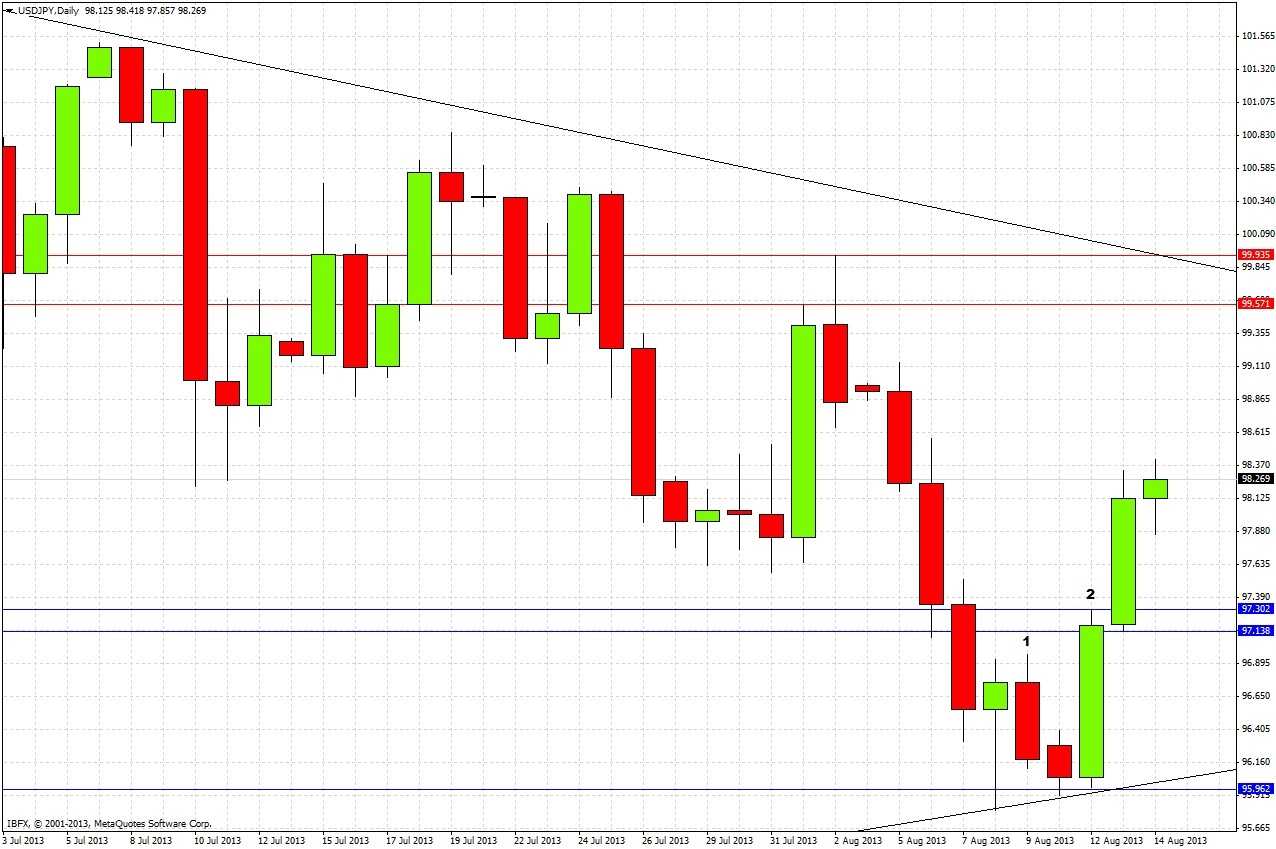
We can get some more detail from the daily chart:

1. There was a bearish reversal candle, which did not break the weekly low, and was then taken out to the upside.
2. There was a strong bullish reversal candle, followed by another strongly bullish day. This should have formed support at the blue levels of 97.30 and 97.13.
So ironically, three weeks later I have to make the same prediction: we are currently stuck within a consolidating triangle, and we are going to need a close beyond one of the black trend lines shown in the chart above to be more confident of direction.
The very long term trend is bullish, the medium term trend is bearish, the short term trend is bullish.
It should be profitable to look for shorts near the upper trend line, and longs at the support level and/or lower trend line, until we get a decisive break of one of the trend lines.

