By: Matt Fanning
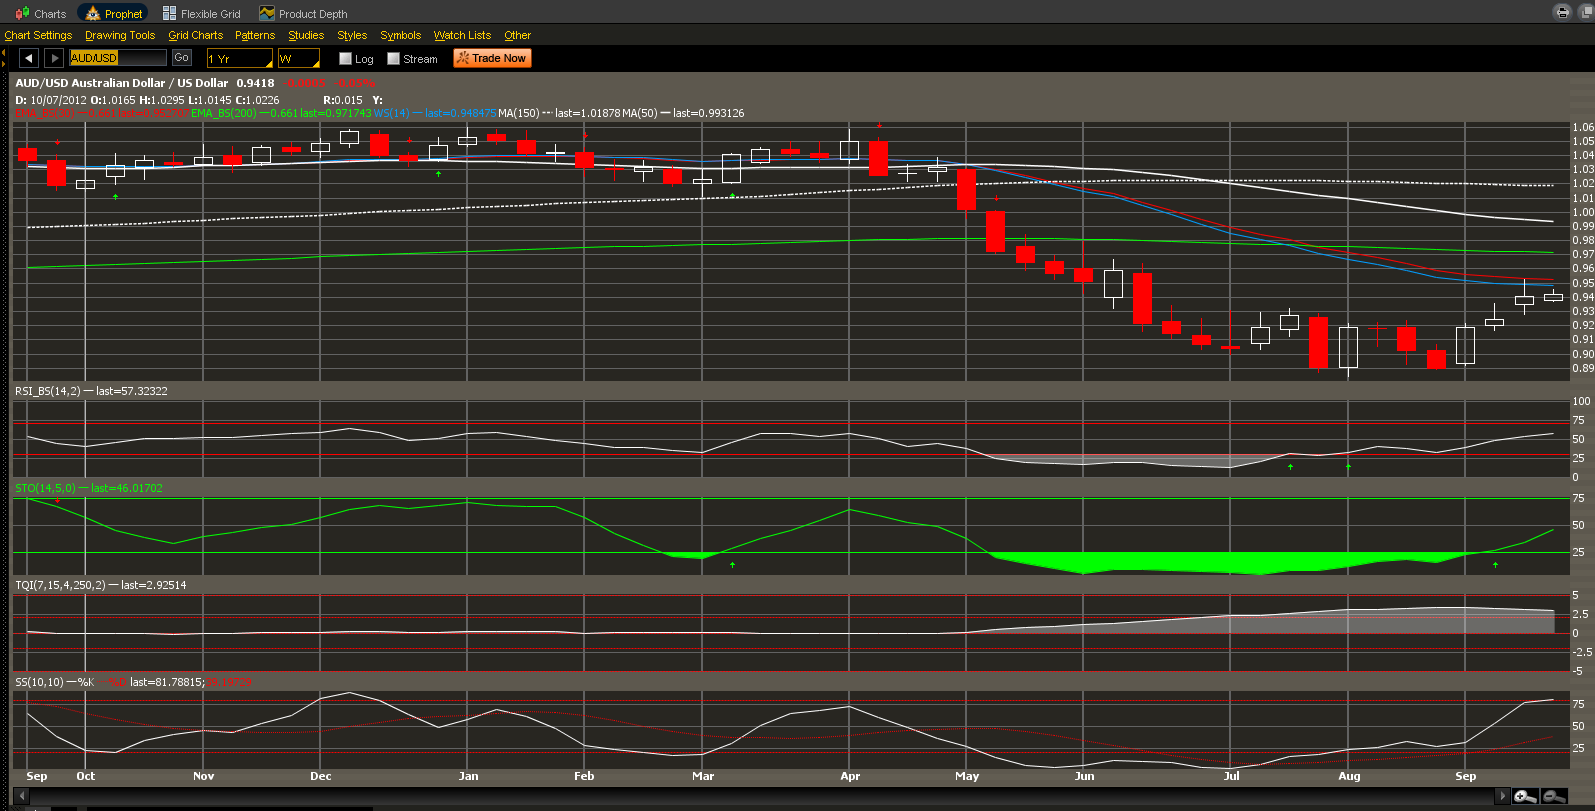
AUD vs. the USD is building a base that if can hold, should setup well for AUD bulls. The pair has made a mid-term bottom at the 90 handle, and within a week has rallied to .95. Currently, AUD is trading at .9417. An important test is right above current levels with the 14 day at .948 and 30 day at the 95 level. If we can hold here, and break above .95, next level to look for should test the 200 day at .97, and the 150 day just above par at 1.01
Relative Strength looks to be turning extremely bullish, with two buy signals in late July, early August. These came right after an extended pull back from the 1.04 level, all the way to .90. Stochastics are making a similar trend reversal, with a buy signal at .92, also showing a heavy bottom base starting in May. Looking at TQI (Trend Quality), which seems to be measuring the pull back from 1.04, shows the strength of that selloff. This trend seems to be finally pulling back from peak levels, which could show the end of one downtrend (a downtrend) and the start of a new up-trend.
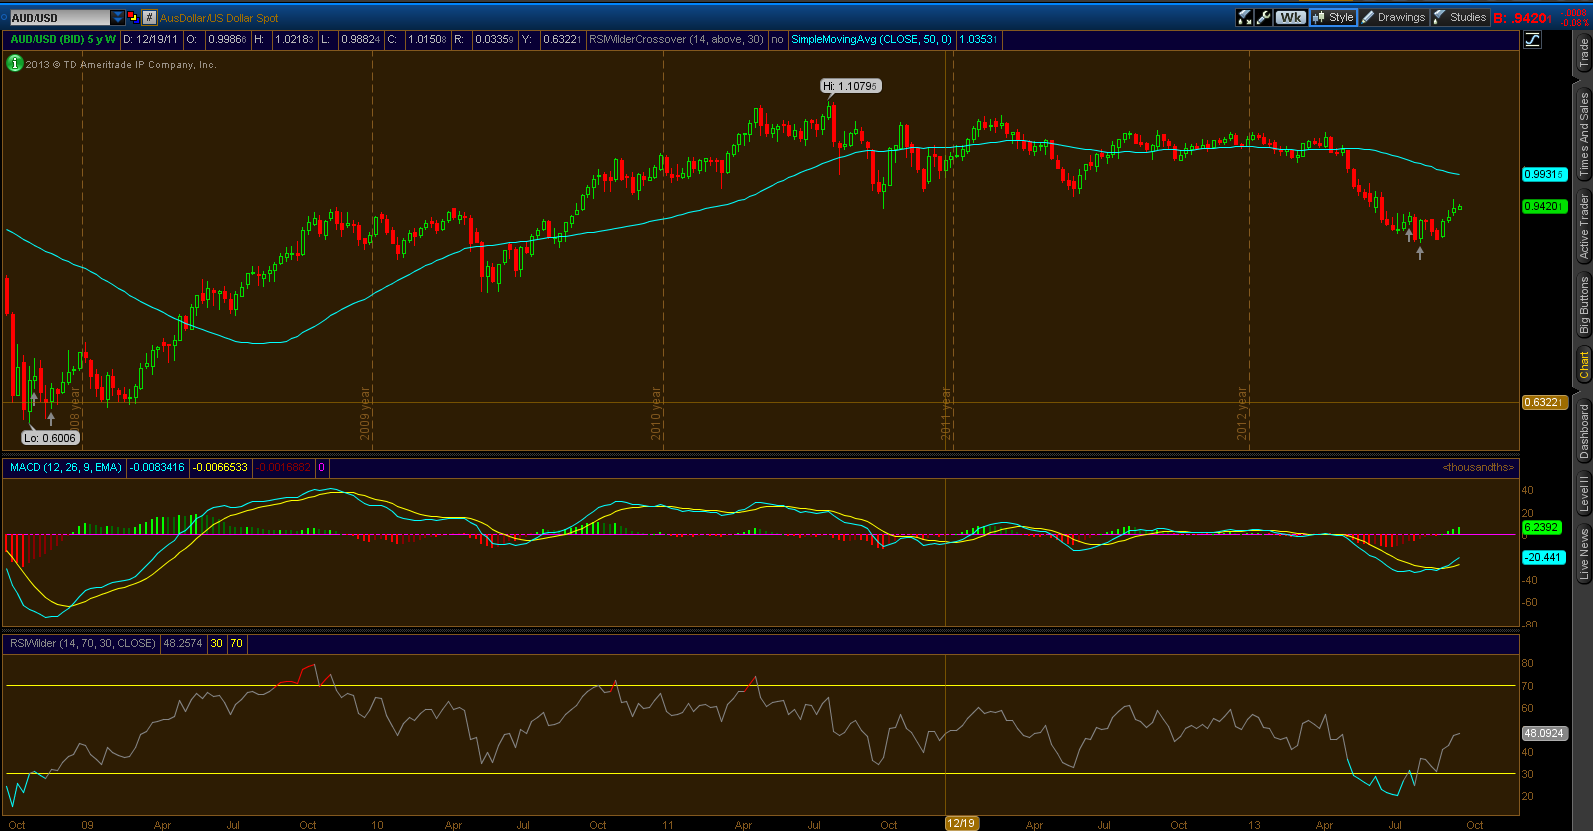
Looking at a longer term chart, 5YR Weekly, Relative Strength made a strong bounce after its last pullback, showing buy signals in August, again at this 90 handle. Last time RSIw broke out as well defined as this break out, was back in November of 2008, when AUD was trading as low as .60. This RSI breakout lead to an 84% incline in price to 1.10, in just less than 3 years. MACD also looks to be making a strong trend reversal to the bullish side, with positive divergence starting from the 9/2 pop in price. A break above .95 is bullish to 97, with higher resistance at the 50 day of .99. If the pair can break thru Par, 1.04 is next level to test resistance, then the 110 level from 2011.
Full Disclosure: FVAM has no exposure directly to AUDUSD pair, above .95 might start looking at FXA


