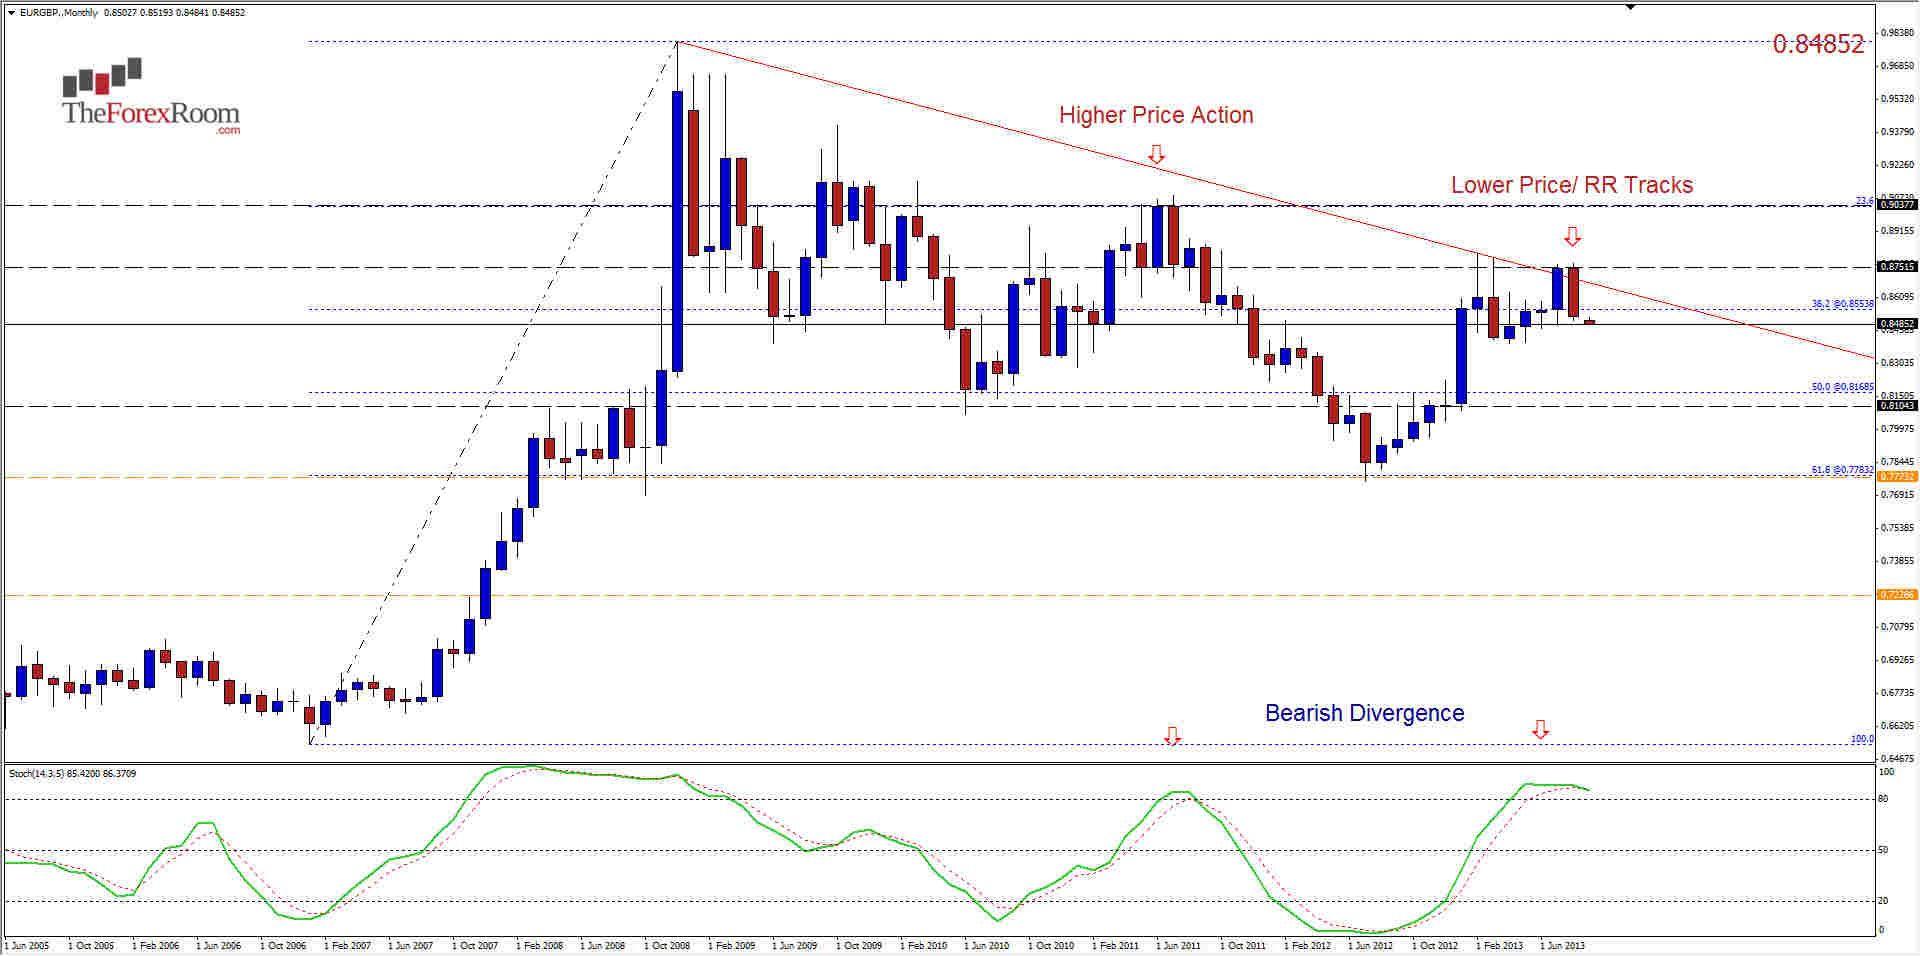
The EUR/GBP Monthly chart is showing clear bearish divergence. As you can see from the chart, we saw price action make a higher high back in February, but the Stochastic below barely made it over the 80/oversold level and still the pair fell almost 1000 pips after that formation printed. Now we see that we have a bearish engulfing/Maribuzo style set-up at the 0.8750 resistance level, basically the same low as we saw for the set-up back in February, but now we have a stochastic that clearly got above 80/overbought (and is already turning downward).
This combination of factors is known as bearish divergence. You can use almost any oscillator to reach this conclusion, such as the MACD for instance, but it just happens that I prefer the Stochastic. I fully expect that this pair will now test 0.8100 where the 50% FIBO level waits at the highs from June 2008 and possibly 0.7700, which you can see is the 61.8% FIbo and low from July (0.7754 to be precise).
We are not talking about reaching these levels overnight, this is more of an investment than just a trade. It might take another year to get back down to July’s lows, but I doubt it, I see this happening possibly over the next 3-4 months if the Fed tapers and the Sterling remains strong...and according to Mr. Carney’s policies, it should for the most part. Stronger than the (doomed?) Euro at least.

