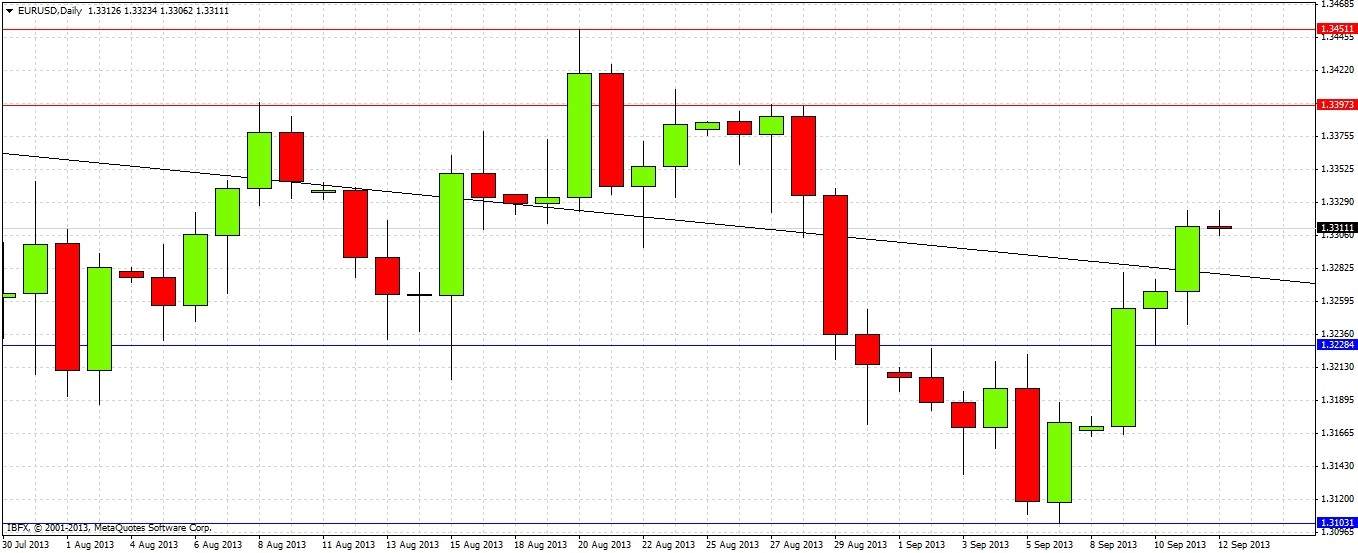
Last Tuesday, our analysis ended with:
"Overall there is a weakly bullish bias. The best opportunities look to be either a long off any bullish bounce off 1.3225 if that holds as support, otherwise if price rises to 1.34 this would be a great area to look for shorts. Should the price fall through 1.3225 soon, look instead for longs off 1.31, 1.3050 and just above 1.30.
The action in this pair is still quite week even though the summer is over. Yesterday the EUR got a bit of life from the news making armed conflict in the Middle East somewhat less likely, but aside from sentiment, this pair seems very dead. Keep an eye on the news, otherwise trade from levels while action remains slow, and don’t expect a huge amount of pips from any winning trades."
Let’s take a look at the daily chart and see how things turned out
The prediction was correct insofar as the price has risen to a high of 1.3323, so calling a weakly bullish bias was correct. However, none of the levels that were mentioned have been reached yet by the price, so it is still too early to comment on that. As was said, the pair has got a bit of life in it now, and has been moving with a bit more volatility, but the real action of recent days has certainly been elsewhere, in the AUD and JPY pairs/crosses.
Looking to the future, we can see from the daily chart that Tuesday was a bullish inside bar, and the price broke out from that bar's high of 1.3275 to the upside yesterday, confirming the weakly bullish bias. Each day has been making higher lows. There is no reason to abandon our weakly bullish bias yet. Below us there is a support zone from about 1.3230 to 1.3300, it is probably quite weak and flexible. Above us, the next obvious resistance level is just under 1.3400 at 1.3797, and above that is the 80 day high at 1.3451. These levels are likely to prove fairly strong resistance, at least when they are first approached from here.
A good trading plan would be to focus upon long trades, at least until 1.3397 is reached, where short trades off obvious bearish reversals should be considered positively. Adequate areas to look for longs would be any of the recent daily lows, especially between the 1.3230 and and 1.3300 levels.
Should price dramatically move beyond the areas discussed so far, there should be good support just above 1.3100 and strong resistance at 1.3500. The 1.3500 level is both a key swing high, a key psychological number, and the 50% fibonacci retracement of a multi-year down wave that bottomed out in 2012 just above 1.2000. When it was hit from below last February, the price began a 750 pip move down.
The President of the European Central Bank is speaking later today. His words can always move this pair dramatically when he says anything that takes the market by surprise.

