Our analysis last Monday concluded with:
"Things certainly look bearish. Friday was a bearish reversal, and the price over the past few days has decisively broken support at 1.0475 that held up over several days, and the longer-term support at 1.0444.
The best bets in the near future look like:
1. A counter-trend long trade somewhere between 1.0372 and 1.0300: this round number should be roughly confluent with the bullish trend line for a few more days. This zone is likely to provide some support, even if only a modest bounce.
2. Alternatively, should the price rise to retest 1.0444, this previous support might turn into resistance and be a great trade to ride a resumption of the downwards move. Above that, there is also the 1.0475 level which could act in the same way.
3. Should price reach the zone between 1.0250 and 1.0275, this area is likely to act as very strong support, so there should be some long opportunity there."
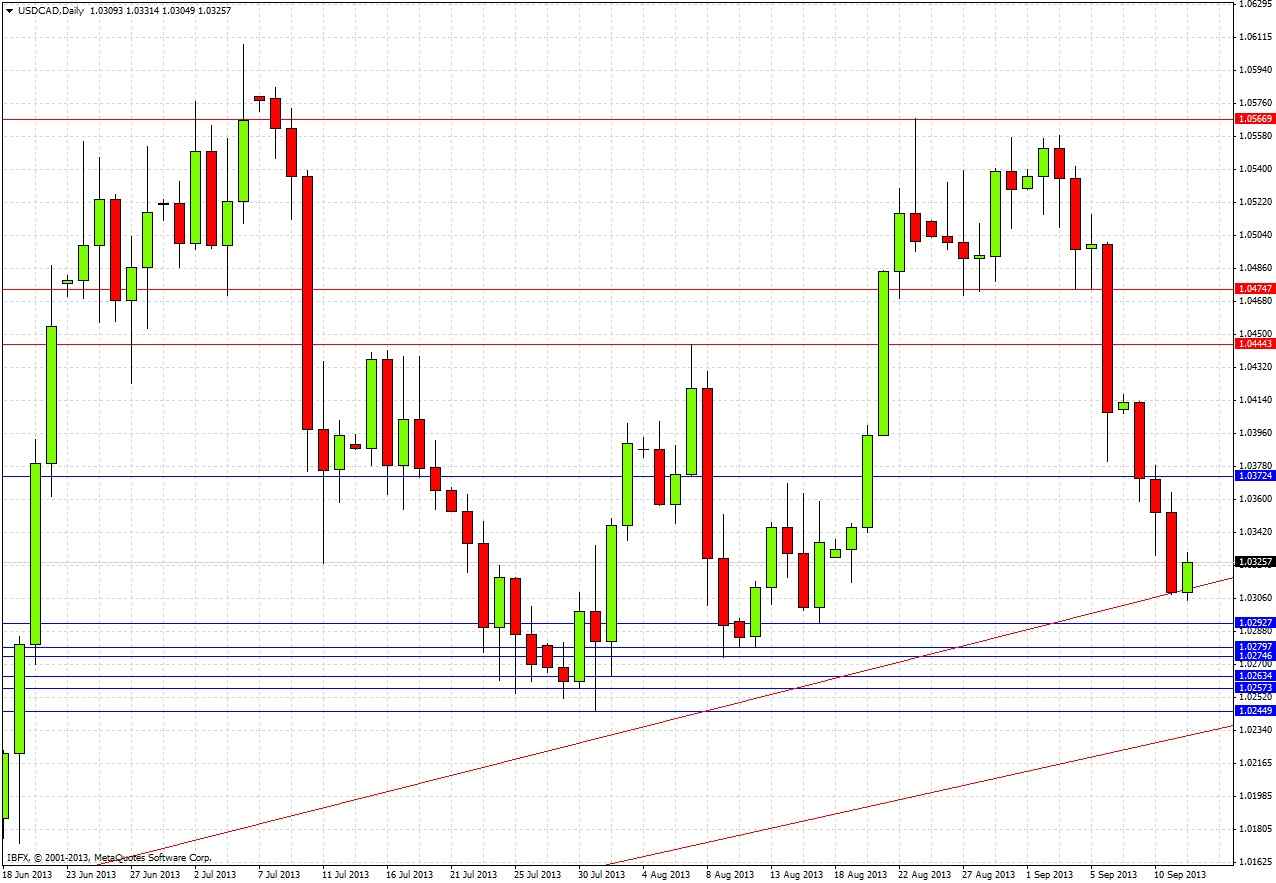
Let's look at the daily chart since then to see how things turned out
The short-term bearish bias was correct: the major movement has been downwards.
Any counter-trend trades between 1.0300 and 1.0375 would probably not have been very successful so far, although the 1.0300 level has held.
The levels at 1.0444 and 1.0275 have not been tested yet.
Looking to the future, we can see three important things from the chart above:
1. The recent rice action has been strongly bearish: over the past two weeks, the price has fallen by more than 250 pips.
2. The price is currently sitting on the bullish trend line which is holding, in conjunction with the 1.0300 level.
3. We have reached close to a zone of very strong support which should provide an excellent opportunity for a long trade.
During July, there were ten daily lows and four weekly lows that printed between 1.0292 and 1.0245. This is a lot of support packed within a fairly tight range.
There is a bullish trend line just above 1.0300 that is currently acting as support. One issue with trend lines is that they can be ambiguous, that is why it is a good idea not to rely upon them alone, and if there is more than one trend line, make sure to draw both of them. To get to this tightly packed area of support between 1.0245 and 1.0292, a bullish trend line will have to be broken. The good news is that below this first trend line, we can draw a second bullish trend line that is currently coming up to just about reach the low of this support zone at 1.0245.
It is impossible to predict exactly where in this support zone the price is most likely to turn around, except to say if the price reaches the lower bullish trend line in conjunction with one of the daily (or even better, weekly) lows, this would be an excellent point to look for a long. The entire zone looks like a happy hunting ground.
It is quite possible that we will not reach this zone just yet, the price might come back bullishly off the upper bullish trend line, and right now it is showing signs of doing just that. If this does happen, be conservative with any longs you might take. It is hard to find any level close by that is likely to act as resistance in a predictable way before 1.0475, which is a long way away from here. 1.0475 will probably act as decent resistance when it is finally reached.
The best opportunity is likely to come as a long trade between 1.0280 and 1.0245. Do remember to be patient and not overtrade: wait for the right moment when it all looks really good.

