By: Matt Fanning
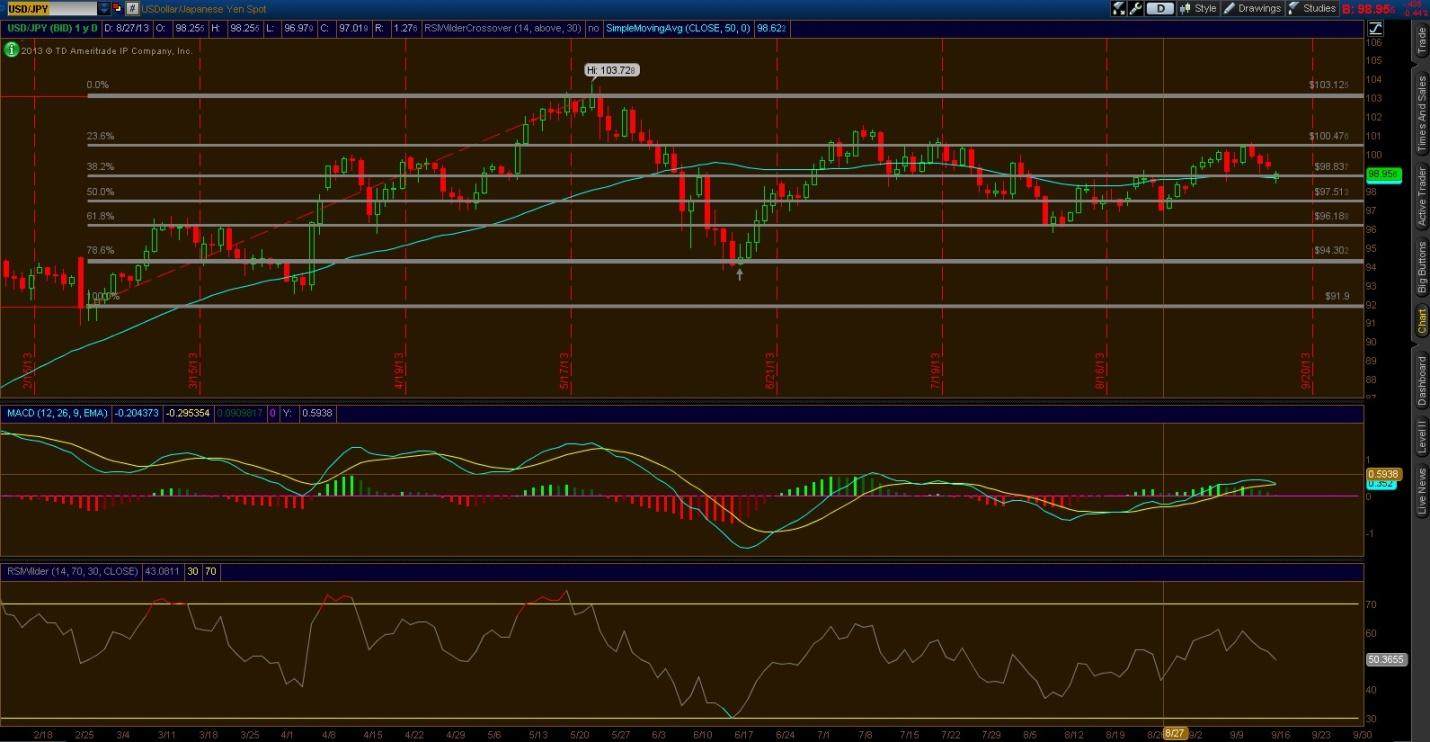
Currently at 98.95 (9/16 12PM EST), the Pair is spot on its 50 SMA (98.72), as well at its 38.2% Fibonacci retracement level of 98.83. If USD/JPY can hold right here, 100.47 is the next level of resistance. This is also the last level where the pair failed to get through, sending it back down to current levels. MACD looks bullish, but looking deeper into that indicator, you can see some possible issues.
The divergence is close to 0, after about 20 days of being positive (bullish). The pair ran up from 97.34 to 100.60 on this divergence, but has been pulling back as the divergence declines. RSIwilder looks even more bearish, with that double top at the 60 handle. We are at support though at 50, but unless the Pair price holds & bounces, this support will also fail, which should lead to increased selling pressure. If the pair fails to hold 98.83, 97.50 is the next support area to watch for, with further support down to 96.18.
On a larger channel, the pair is still in a range between 91.90 and 103.13. Most important support level looks to be the 61.8% Fibonacci level of 96.18, which held and bounced perfectly in early August. The pair needs to get thru 101.10, resistance on 7/9, to make an attempt at the 103 level.
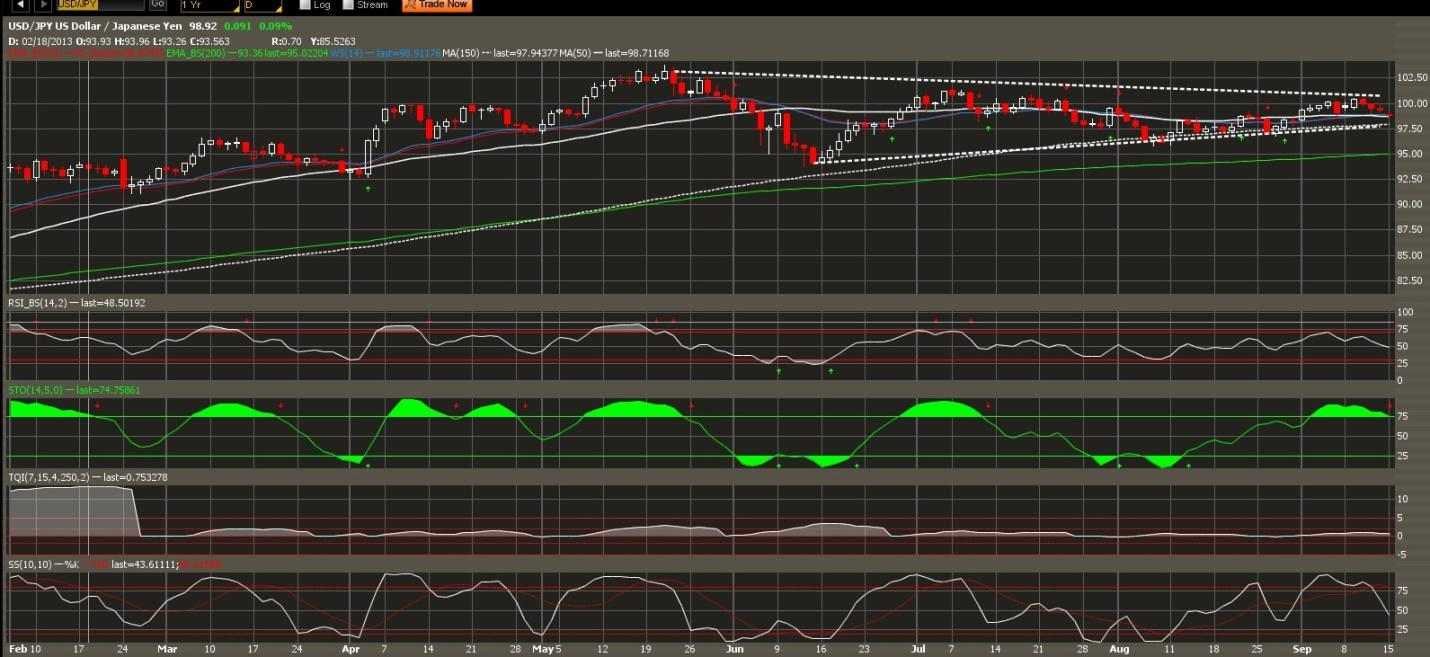
Digging further into the Technicals, the Pair is still within its wedge pattern, failing at 100.60, now trending towards the lower end of 97.50, important support. RSI is still trending bearish, now below the 50 handle, although does have a support level to test at 44. You can notice in the chart a Sell Signal which formed today at the Stochastics level, breaking below 75. We have not seen a sell signal within this indicator since 7/11/13, where the pair pulled back from 99 to 96.
The pair will need confirmation in the next few sessions if this sell signal will be successful. Making the pair’s current level of 98.95 even more important to hold support, this level is right on its 14, 30, and 50 day moving averages.


