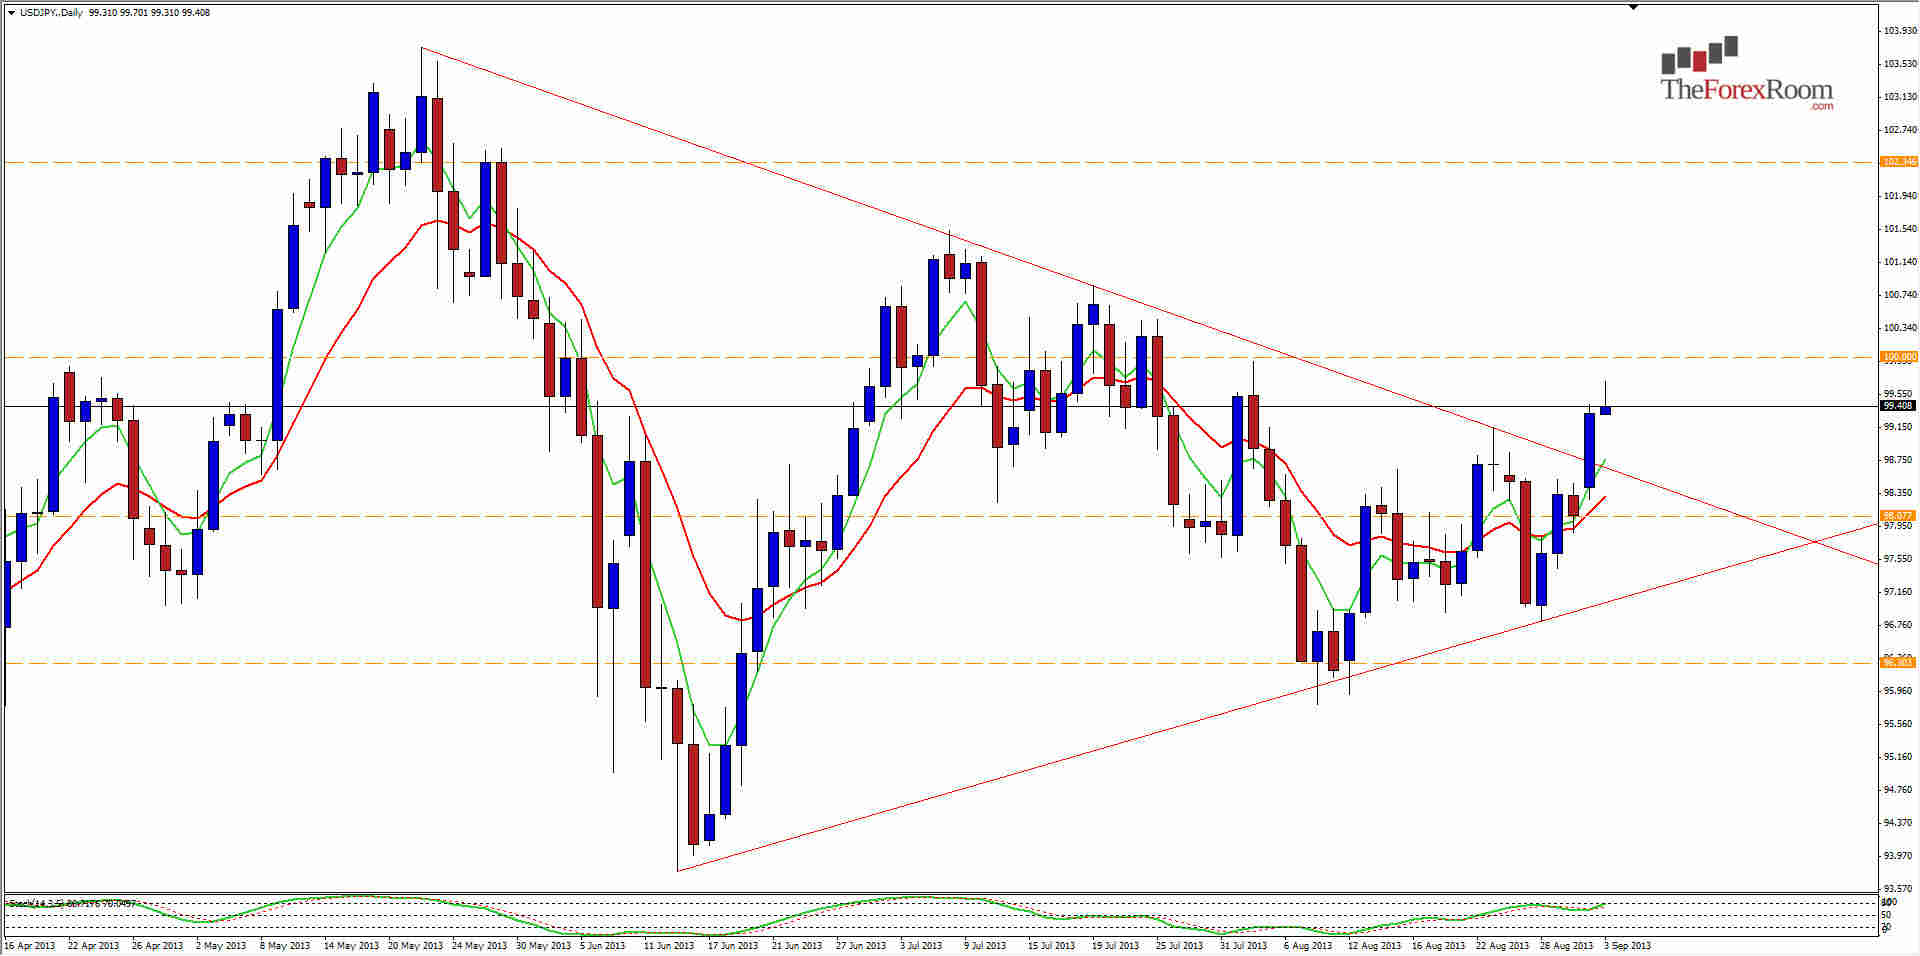
The USD/JPY daily chart has been trading itself into a descending triangle, and yesterday it finally broke this triangle with a bullish daily candle that closed at 99.32. Since then, we have seen this pair reach as high as 99.70 and may now pull back to the top of the triangle at 98.75 before continuing higher.
This is common for a pair that breaks out of consolidation, and poses a threat of falling right back in to a bearish trend. Sometimes we see moves like this only to see the pair fall back into and break below the formation. That said, in this instance many traders are hoping for another long bullish run towards 104. If that happens, watch for resistance at the major round number of 100, before testing July’s highs at 101.53.
Clearing 101.50 will surely bring buyers in again and above 103 the door to 105 will open rapidly. Support other than 98.75 waits at 98 even, 97.00 (lower triangle) and 96.30. Providing we can stay above 98.50 I will remain bullish on this pair.

