Last week's analysis ended with the following predictions:
1. Worth maintaining a bullish bias provided that 98.54 and the bullish channel hold.
2. Between 100.40 and 100.85 there should be good shorting opportunities.
3. Should the price break decisively through 100.85, it is likely to rise up all the way to 103.50.
4. A good way to monitor bullish progress over time will be to watch whether the bullish channel's lower trend line or the triangle's upper trend line breaks first.
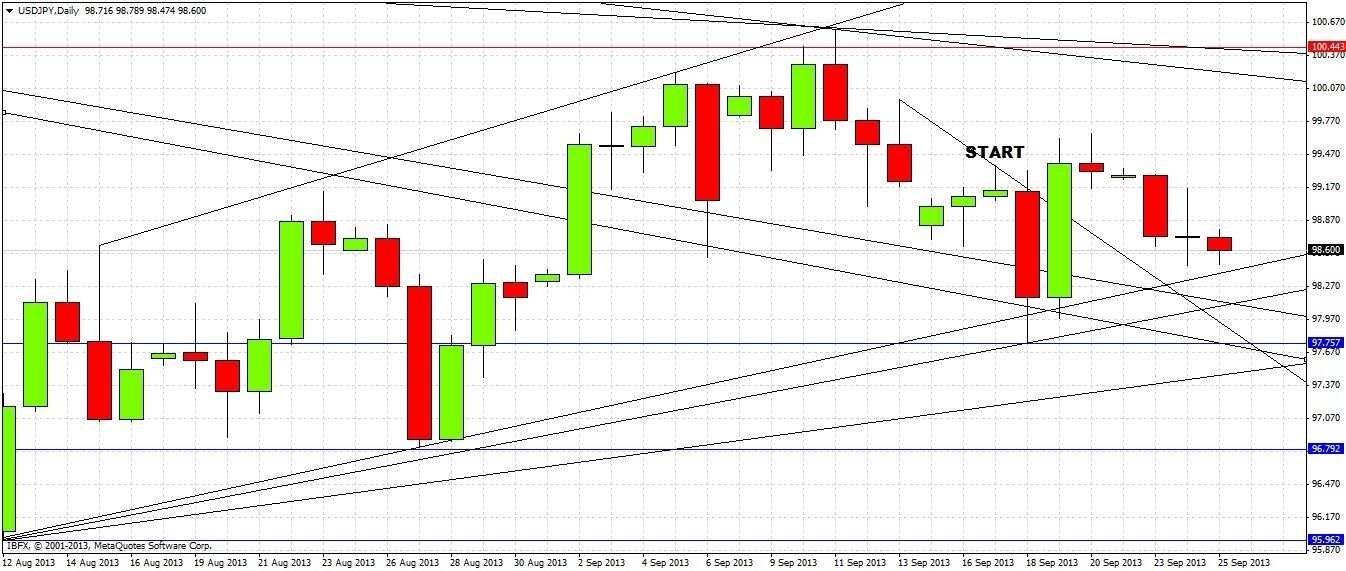
This prediction had a mixed encounter with reality. The price fell sharply after the Federal Reserve's announcement last Wednesday evening, but returned quickly, so although 98.54 was broken the price only spent about 3 hours below this level, and the bullish channel's lower trend line held well. The price made a new low of 97.75. The other levels mentioned were not hit. We can see how it played out in the daily chart below since the “START” label:
The weekly chart does not add much, so we can keep this daily chart as our highest time frame for the purposes of the analysis.
The first thing to note is that when the price came down to make a new low of 97.75 after the Fed's announcement, it was retesting both the lower trend line of the bullish channel and also the apex of the old triangle which had contained the price over the summer. It is significant that these levels held bullishly, and we can see that the next daily candle was strongly bullish, tracing out a bullish reversal and closing very near to its high. This candle did break to the upside during the next day, which should be a sign of continuing bullishness, and this is where things get interesting. Since that bullish break the price has instead been slowly but significantly falling off its highs and making new lows every day. So far the lower trend line of the bullish channel and the low of the bullish reversal candle have held, however.
Note the shorter-term bearish trend line that is drawn just by the “START” label. That was broken by the bullish reversal candle, to the upside.
Although the bullishness is muted right now, the major signs technically are still bullish until we get a significant break to the down side of 97.75, despite that level being somewhat under the bullish channel's lower trend line. It is quite likely that the this trend line will hold in any case. Apart from that, all of last week's predictions and advice are still relevant. It should be added that if 97.75 is significantly broken, the price is likely to reach 96.80.
This pair remains one of the most key pairs in the Forex market at the moment and should offer more good trading opportunities. The possible trades likely to arrive soonest are aggressive longs off the lower trend line or more conservative longs at a retest of 97.75.

