Our last analysis on September 23, 2013 ended with the following predictions:
1. Overhead resistance at 0.9525 should hold
2. Support below at 0.9223 should hold
3. Zone from 0.9300 to 0.9350 may act as good support
4. Long-term bearish trend is over
5. Overall bullish bias
This forecast worked quite well. Neither 0.9500 nor 0.9223 have been hit, so we cannot comment on these levels as they have not yet been tested. However, the price did fall back to the 0.9300 to 0.9350 zone, reaching a low of 0.9286, from which it rebounded to a high of 0.9334 yesterday. There were a couple of good opportunities to enter long on bullish inside and reversal candles at levels close to 0.9300.
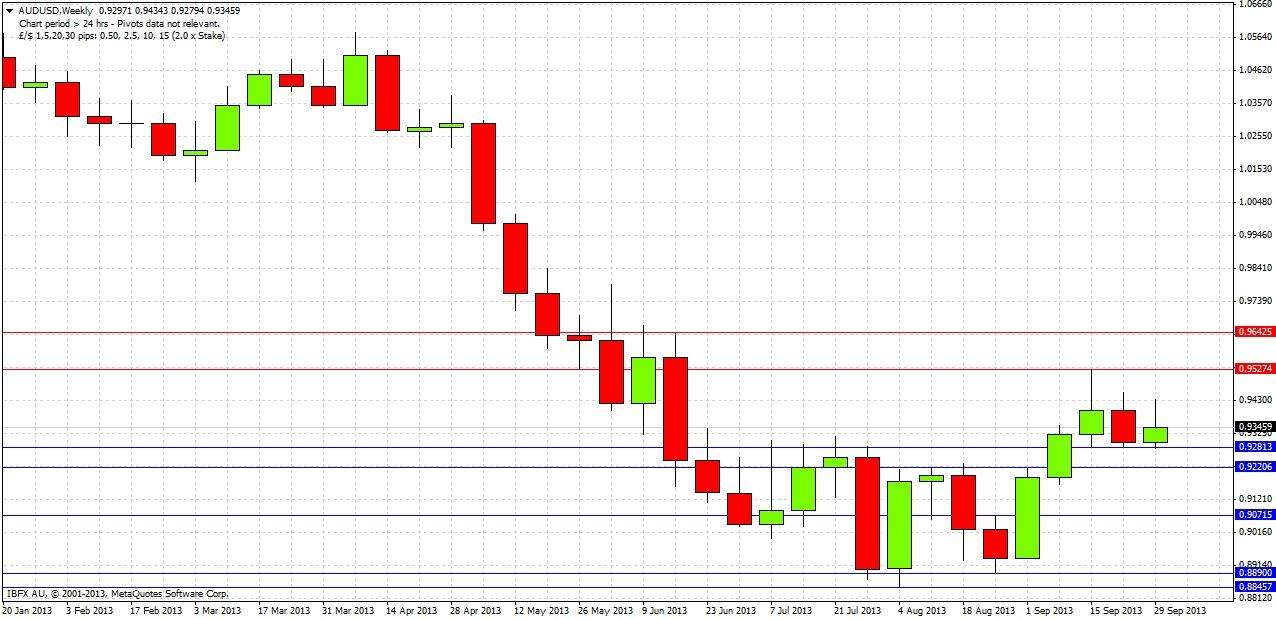
Turning to the future, let's begin by taking a look at the weekly chart
This weekly chart shows that last week was a bearish reversal candle, but that its low was only broken by a few pips and seems to have become established as a support level. There is therefore some bearishness, accentuated by the lower high each week compared to the week before, over this week and the previous two weeks.
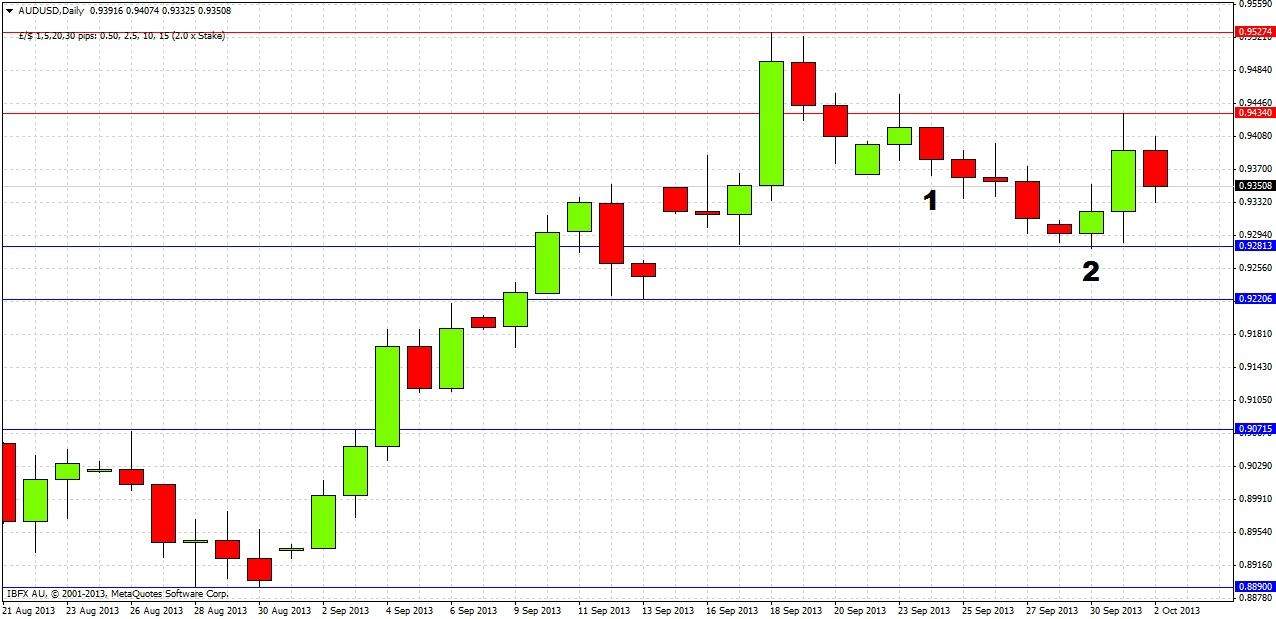
Let's get some more detail and take a closer look with the daily chart
Some bearishness was re-established by the bearish reversal candle marked at 1, which led to a continued fall and retest of the 0.9281 level (the previous week’s low) which held as support. The bounce from this level produced a bullish reversal candle (marked at 2), and the next day the high of the previous bearish reversal candle was broken for a while.
Overall the picture is mixed, and it is difficult to predict what is likely to happen next. The support levels at 0.9281 and 0.9223 still look like good levels for longs, especially from any bullish bounce that might show on a short term chart at the next test of either level. Apart from that, the best course of action should be to sit tight and see if any of the marked support and resistance levels are broken. If the level of 0.9223 is broken significantly to the downside, say with a daily close more than a few pips below this level, this would be very indicative of a more bearish situation. Overhead, the zone from 0.9500 to 0.9525 should act as strong resistance, and if broken to the upside this would be a very bullish sign.


