Our last analysis one week ago ended with the following predictions:
1. Hard to predict what is coming next
2. Longs look good at 0.9281 and 0.9223
3. Daily close below 0.9223 will indicate bearish bias
4. Area from 0.9500 to 0.9525 should act as strong resistance
5. Break of 0.9525 will indicate bullish bias
None of the levels mentioned have been hit, action has been generally bullish but weakly so. The support and resistance levels shown on the previous weekly chart have been respected. The day of the last analysis is marked with Start in the daily chart shown below:
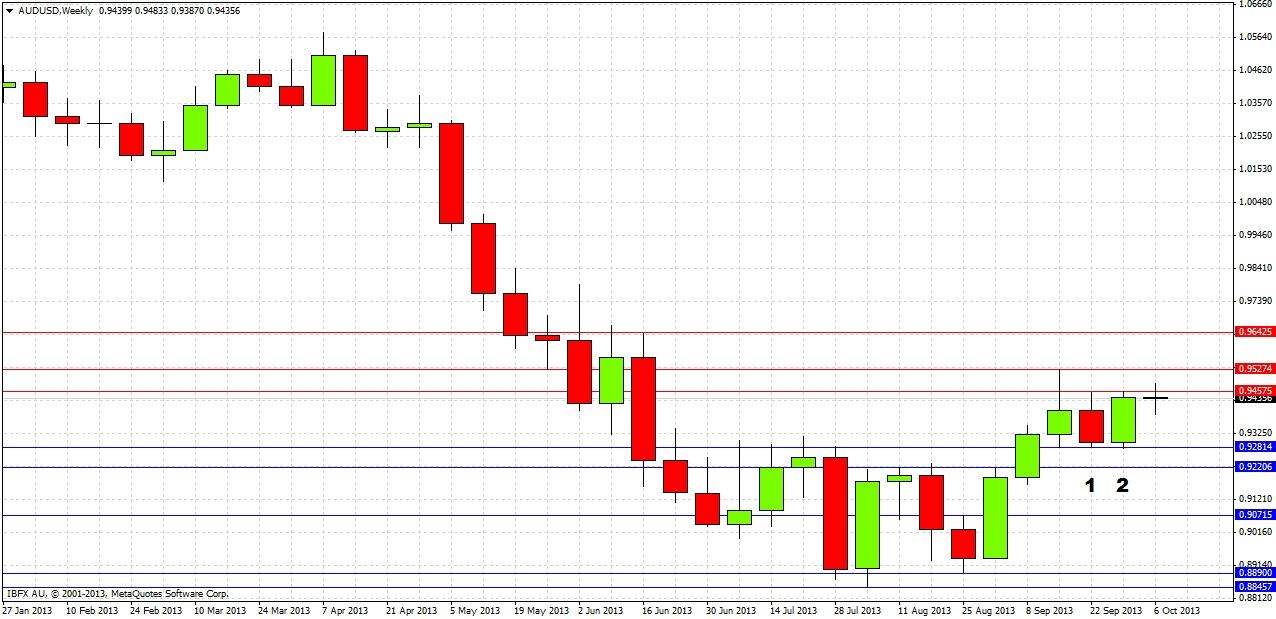
Turning to the future, let's begin by taking a look at the weekly chart
This weekly chart shows that the week before last week was a bearish reversal candle, but that this was then followed last week by a bullish reversal candle. The high of last week’s bullish reversal candle has been broken to the upside already this week, which is a bullish sign. Notably, the last two weeks had almost identical ranges, showing that there is a lot of indecision, and that the resistance at 0.9457 and the support at 0.9281 are both strong levels under current conditions, with the support being the stronger. The overall bias from the weekly picture is definitely bullish.
Let's get some more detail and take a closer look at the daily chart
We had a bullish reversal last Thursday (marked at 1), and then again yesterday (marked at 2), although yesterday was weak, closing in the bottom half of its range and being unable to close above the resistance level at 0.9457. This gives us a weak bullish bias.
It is still hard to predict which way this pair is going to go over the next few days, but the recent daily bullish reversal candles have given us some new support levels to test. We can watch whether the lows at 0.9408 and 0.9365 hold. If so, this supports the weak bullish bias that we have from the recent price action. If these levels are broken to the downside, we are quite likely to move down to 0.9281. However, a breakout past 0.9457 will be a bullish sign, and past 0.9527 will be a very bullish sign, especially if we get a daily close beyond that level.
In the absence of any dramatic moves, the best trades are likely to be fades of the support and resistance levels. The predictions from our last analysis still look valid.


