Our analysis last Wednesday ended with the following forecast:
1. Makes sense to end the bearish bias and close any long-term short trades.
2. A strong break down through 1.5915 re-establishes short bias.
3. A strong break up through 1.6018 establishes a long bias.
4. Probably greater potential on the short side, but price is not ready to fall just yet.
5. May be good opportunities to short from 1.6018 and 1.6150 later.
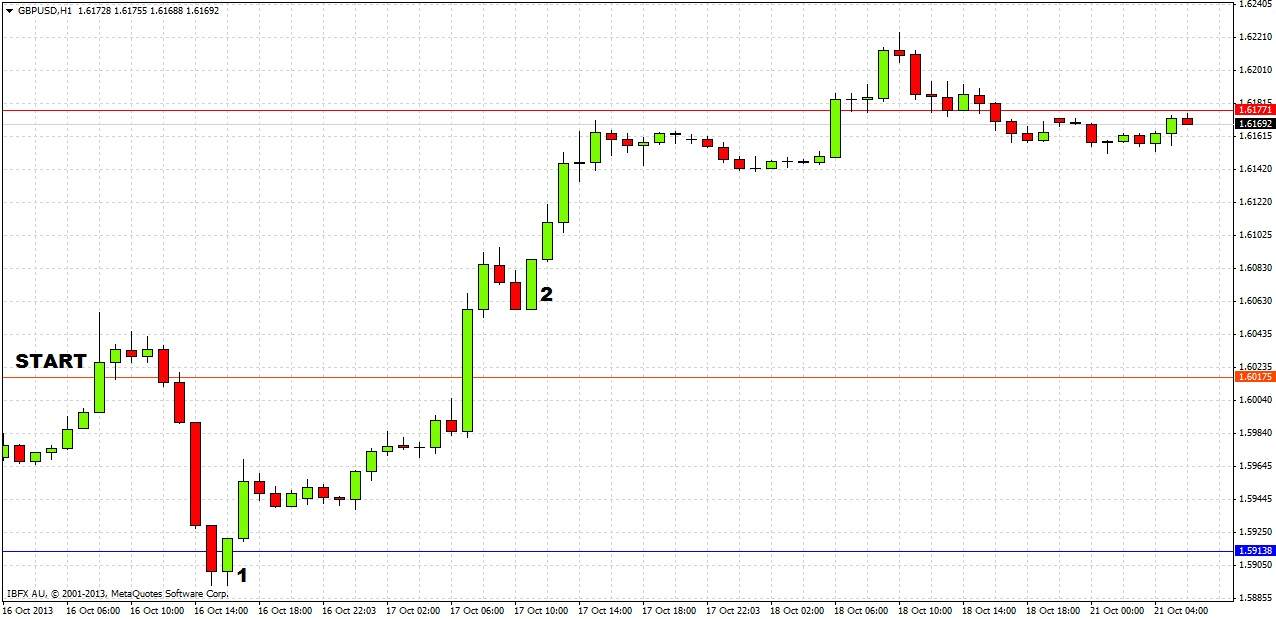
What actually happened since the previous analysis is that the price spiked up to about 1.6050, then fell hard to just below the support at 1.5915, but it only spent an hour there before beginning its steep rise, peaking at 1.6224 early during Friday’s London session, as shown in the 1 hour chart below:
The forecast worked well, as it was certainly correct to close out shorts and wait for a serious break below 1.5915, which did not happen. In fact the hourly chart showed a sharp inside bar rejection from about that level, marked at (1) on the chart above. The long bias stipulated in the forecast was established halfway through Thursday’s London session by the bullish reversal bar off previous resistance followed the strong breakout above 1.6018, marked at (2).
A short on the very day of the prediction from 1.6018 could have yielded over 100 pips with a stop of about 40 pips, and it did travel down to the predictable support at 1.5918 so was a very tradable move. However, it has to be said that shorting at the test of 1.6150 would not have worked very well, although the price did pause at this zone on its way up.
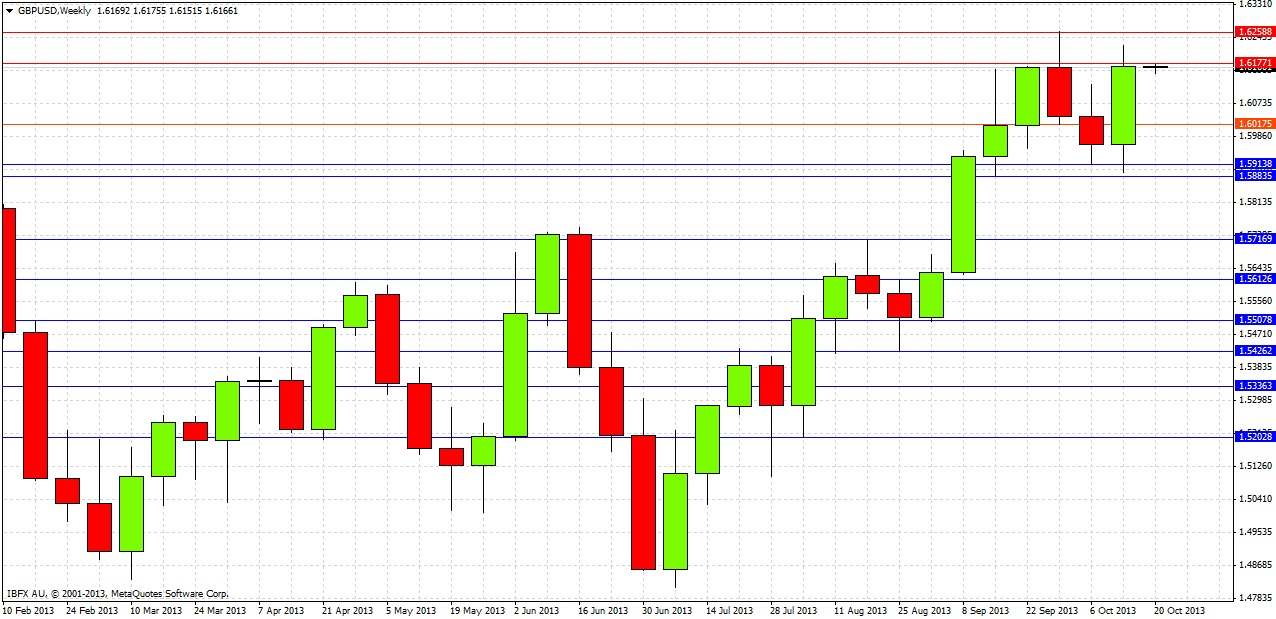
Turning to the future, let's start by taking a look at the weekly chart
Last week was a bullish reversal candle that closed in the upper quartile of its range, just under a well-established resistance level at 1.6177. This is a bullish sign, but the resistance seems to have already had a halting effect on the price. This resistance zone has been well established for over 2 years. It is possible to draw a triangle on the monthly chart that shows we are currently sitting right on the upper trend line just below a breakout, but it is not a very convincing triangle so will not be included. It is enough to say that there is plenty of upwards momentum, but further significant upwards progress will be a very significant event and the resistance overhead could well be too strong.
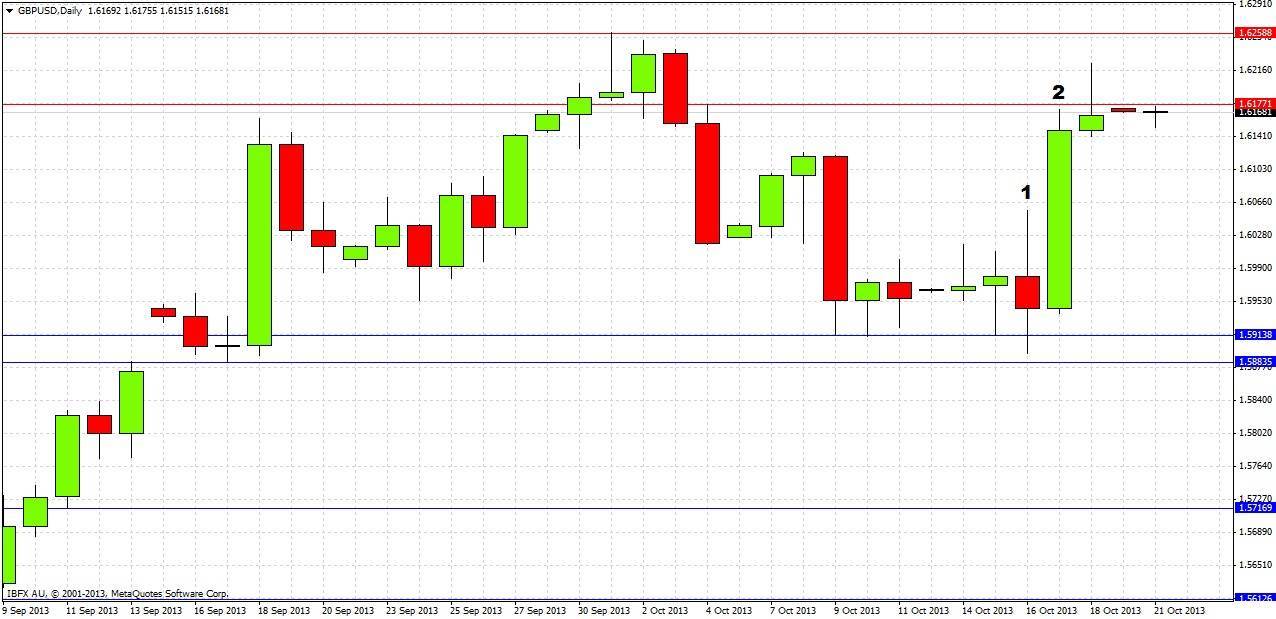
Let’s turn to the daily chart now for a more detailed look:
Action was very quiet early last week, with the support zone significantly holding firm from around 1.5900. Wednesday produced a bearish reversal candle marked at (1), but with a long lower wick, signifying support, and this was followed by the sharp upwards move on the Thursday, which was prompted by the resolution of the US debt ceiling deadlock. Thursday produced a very bullish reversal candle, marked at (2), closing in its upper quartile, before a small bearish pin bar was formed at resistance on the Friday.
Predicting what will happen next is extremely difficult. We have strong bullishness, US dollar weakness, and plenty of very strong upwards momentum. However, we have entered a very well established resistance zone, which really gets going at 1.6250 (a very key level) and runs for a few hundred pips above that level, so confirming a breakout will be almost impossible.
The only predictions that can be made now are:
1. The support level at 1.6057 would be a good place to look for longs.
2. The zone around 1.5900 – 1.5925 would be an even better place to look for longs.
3. The resistance overhead is likely to be strong, with 1.6250 being an especially good place to exit longs or look for shorts.
4. No recommendation to touch trades any of these levels.


