Our analysis last Wednesday ended with the following predictions:
1. We have begun a down trend, which will be confirmed by a break below 1.5879.
2. A daily close above 1.6075 will invalidate the down trend.
3. The 1.6025 level should be a good point to enter a short trade.
4. There are support levels at 1.5879, 1.5825, 1.5750, and 1.5718.
What has actually happened over the week that has passed since then, is that the price moved sharply up to a high of 1.6094 that same night, closing at 1.6073 just 2 pips short of the level which was predicted to invalidate the down trend. The next morning the price returned to 1.6020, then rose steadily during the remainder of the week. So the prediction was not useful, except for identifying 1.6075 as a closing level to invalidate the down trend. Entering a short trade at 1.6025 would not have produced good results.
The support levels mentioned have not been tested yet.
Turning to the future, let's start by taking a look at the weekly chart
Last week was a very bullish week, closing very hard on its high, and exceeding the high of the previous week. This candle also has a lower wick. However, looking at this week’s candle, so far we are seeing a bearish rejection from the supply level established by the outside engulfing candle (marked at 1). This zone runs from 1.6177 to 1.6377.
Let's drill down for some more detail by taking a look at the daily chart
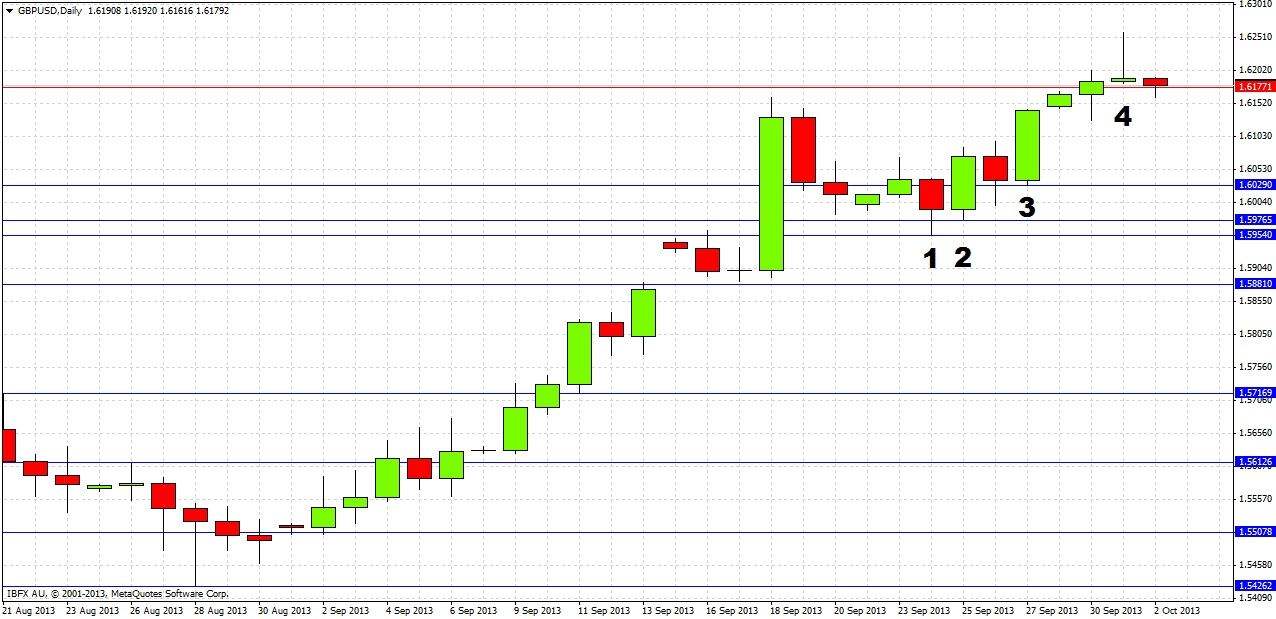
Last week was certainly bullish, although it began with a weak bearish reversal candle (1); this was then followed quickly by two strong bullish reversal candles (2 and 3). The price then on Monday entered the bearish zone identified on the weekly chart from 1.6177 to 1.6377, and moved higher yesterday, before a fairly sharp rejection that created yesterday’s daily pin bar (4).
Overall the chart action suggests strongly bullish momentum, but that we have reached a resistance zone which the price will find hard to penetrate. The trend is quite likely to reverse from this zone, or at least consolidate here for a while.
Predictions for the coming week are as follows:
1. A daily close below the weekly open at 1.6148 would be strongly indicative that the upwards trend is over.
2. A daily close above 1.6177 close to the high of a daily candle will be a bullish sign.
3. It is possible to be aggressively short right now, or on a future pullback to the key psychological level within the resistance zone of 1.6250.
4. There are support levels at 1.6029, 1.5977, 1.6954 and 1.5884 (this last level should be especially strong). They can be used as take profit target on shorts or as long entries under relaxed conditions with bullish reversals.
5. It is worthwhile to take profit on existing long trades.


