By: Matt Fanning
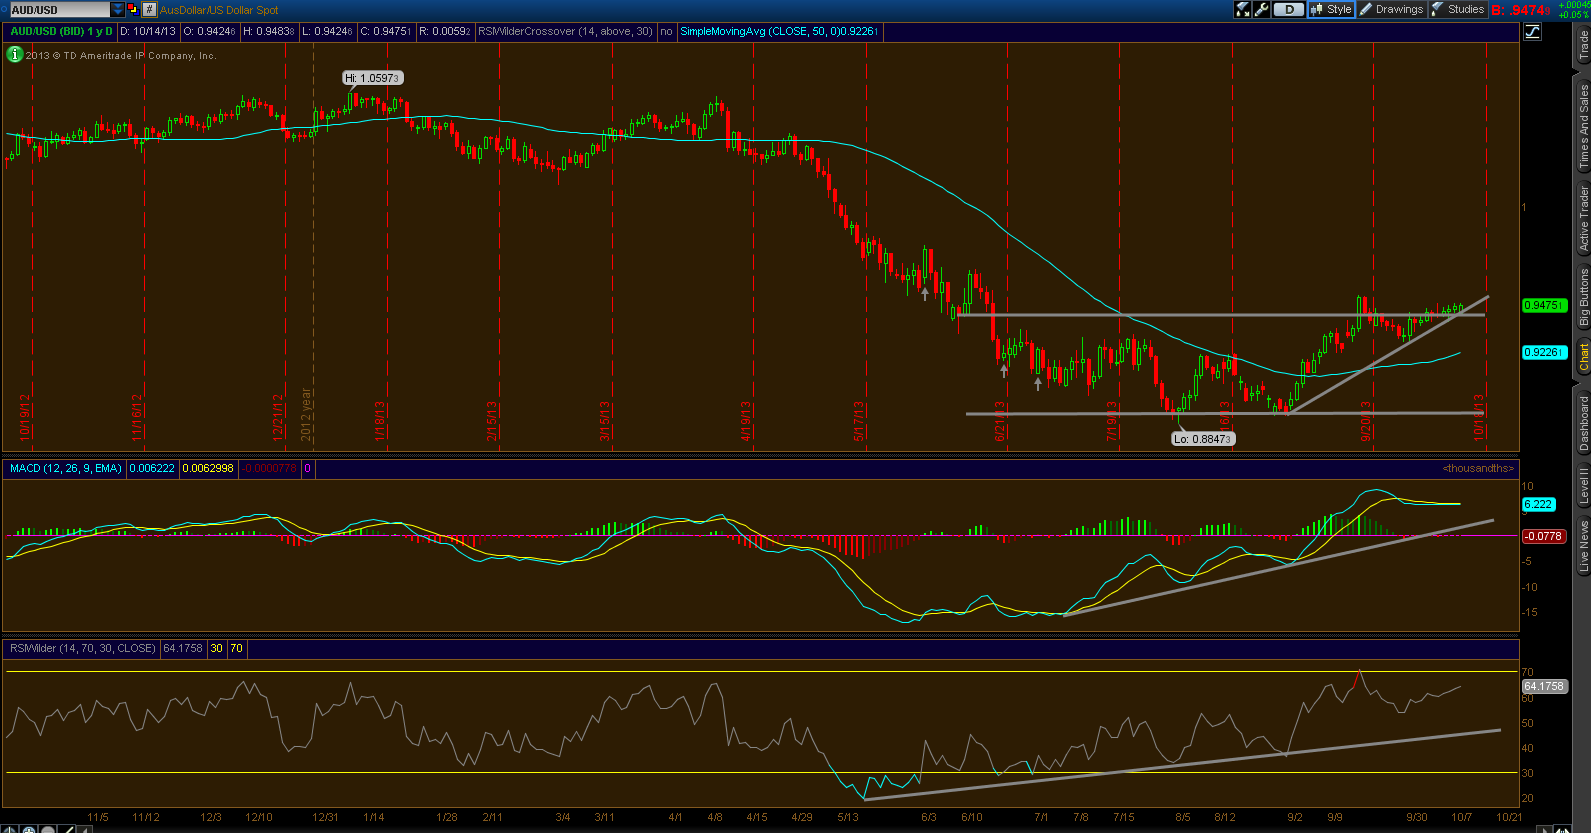
Aussie versus the US Dollar is still on an uptrend since the end of August, from .89 to currently at .9472. Short-term immediate support at .9425, and could trade on the long side, with that level as a stop. Resistance above at .9510, if the pair can break thru this level, it should retest resistance from June at .9636. The 50 day shows what looks like a solid base for the Aussie, if holds and continues this new uptrend, the Pair could retest levels just above Par, with 1.01 being next major resistance. If this uptrend matches up with the duration of the downtrend, we could see this test by December to January.
MACD and Relative Strength have both been on an uptrend since May, and currently not showing any reversal signs. Albeit in Overbought territory, but recently have trended sideways, giving back some of its overbought levels, leaving room for buyers to come back in and the Bid the pair higher. Today specifically, could actually mark the first bullish divergence in that MACD, after 10 days of negative to flat divergence.
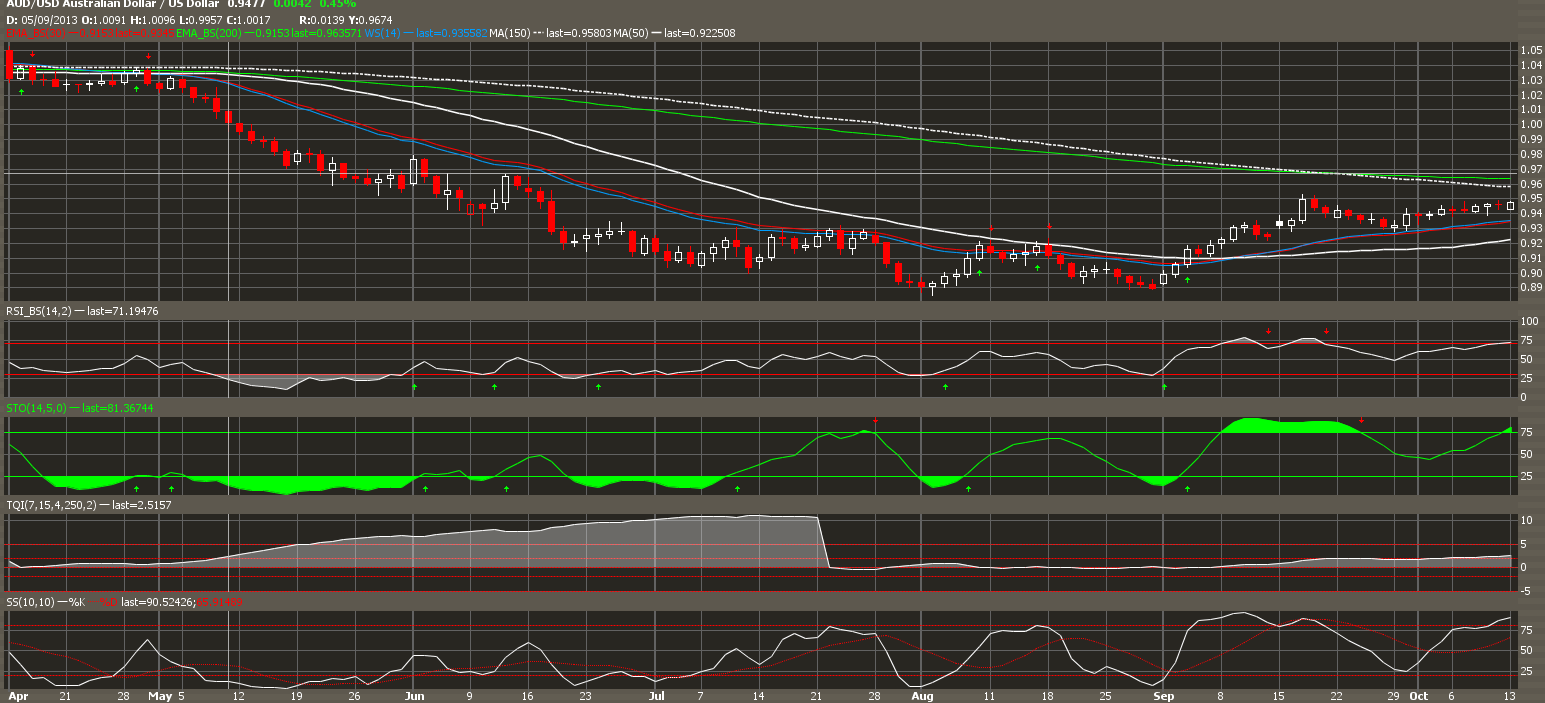
Looking further into the internals of the AUD/USD Pair’s trend, what indication flashes the most is TQI, or Trend Quality. From April, the pair traded off a cliff, straight down from above 1.04 to .89 in just 4 months. Comparing the selling to the quality of Trend, the chart clearly shows how strong the selling was. A massive multi-month selloff, where the selling just kept on magnifying to stronger and stronger levels, until July, where the Trend itself comes to a halt. Pricing levels remained mostly flat until more recently in September, where it seems the pair has made a strong double bottom at .89. As well, continuing the focus on TQI, a building of Trend is beginning. With the pair now trending up, the ball is now in the Bulls court. If this trend continues, and begins to matchup with the massive sell-off trend, we should be able to trend right back to par, with that resistance at 1.01.
More strength for the bulls, the pair is currently above 14 & 30 day moving averages, also far above its 50 Day of .925. Next MA level to retest is the 150 day, which is currently at .958. Longer term 200 day moving average is currently .964
With resistance right above current levels at .9494, the long trade could either wait till the pair trades above this level, going long at .95 and using the .94 handle as a stop. Another idea, could short the Pair, with .958 as your stop, targeting .93


