The previous analysis on Monday last week can be summarized as follows:
1. The general overall bias is bullish, until a daily close below 1.0250.
2. Long trade recommended at 1.0250, or on a bullish reversal from 1.0268.
3. If the price does not pass 1.0340 within a few days, we are likely to see a retest of 1.0268.
Let's look at the daily chart since then to see how things turned out
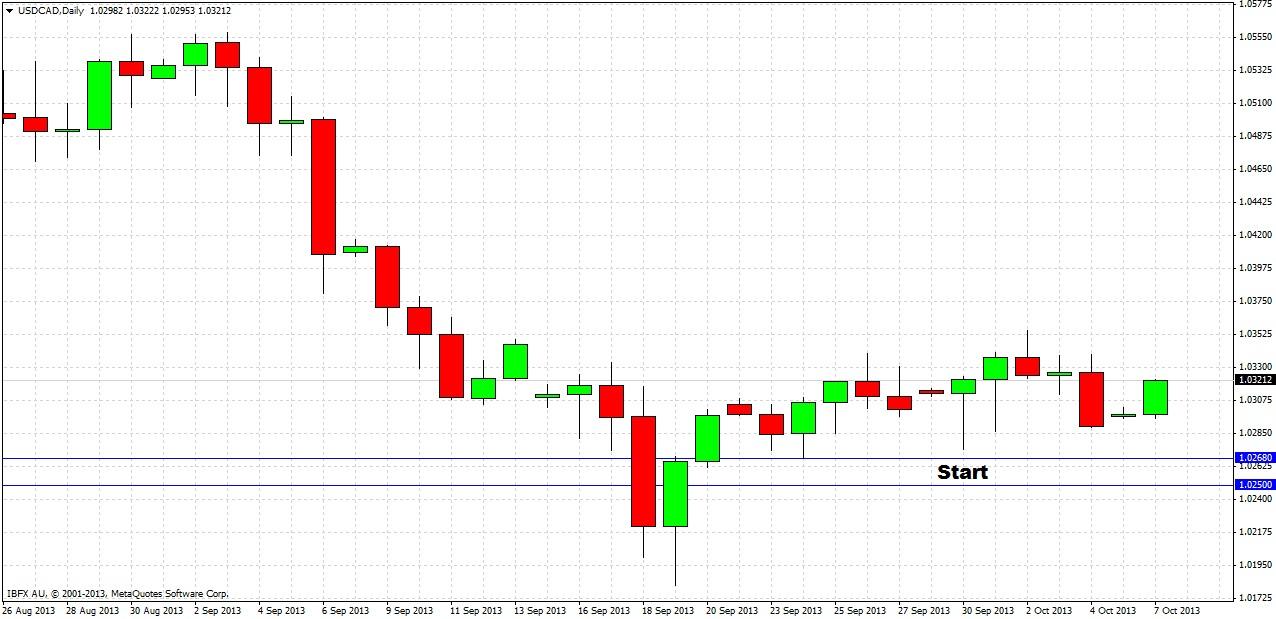
The price did break 1.0340 within a couple of days of the previous forecast (marked at Start on the above chart). The price has not touched 1.0268 on the down side. In general, the action has been very quiet and sideways. We can say the prediction has been useful insofar as it would have kept traders out of a sideways market, and the overall bullish bias may still be proved correct.
Turning to the future, let's start by taking a look at the weekly chart
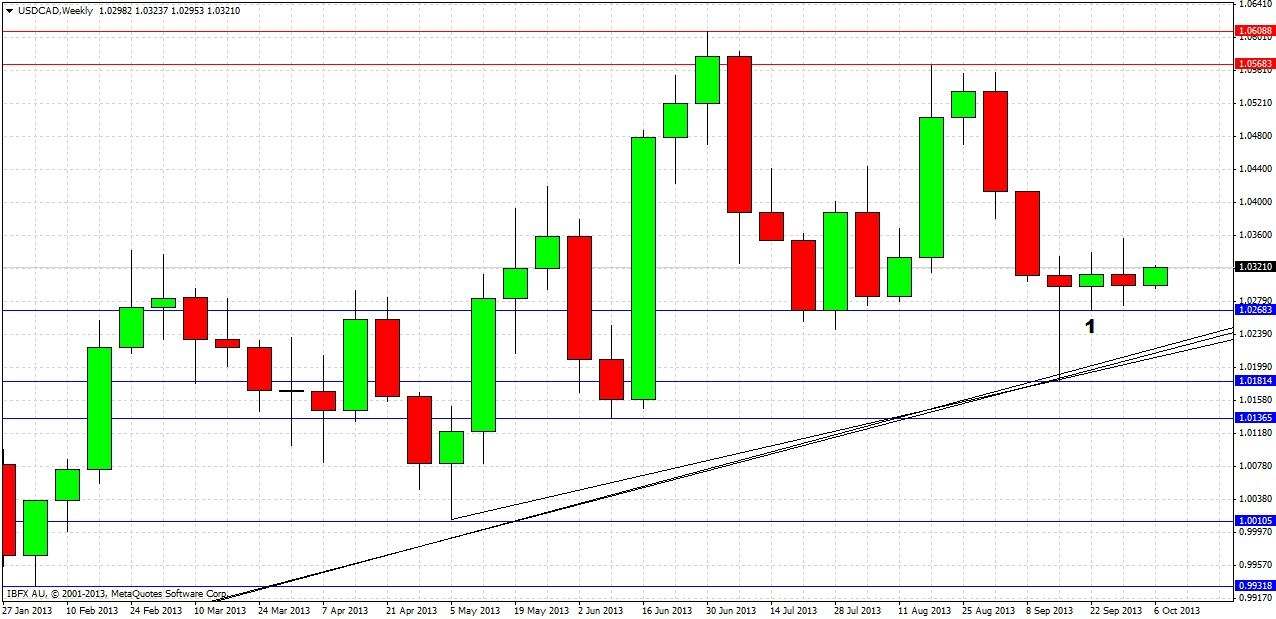
We can see that there are three long-term bullish trend lines below the price. Although there is some ambiguity, they are not too far apart, so we can expect some support around these lines.
The action has been very quiet over the previous two weeks. Since the pin bar off the bullish trend lines, we had a very tiny bullish reversal candle (marked at 1), then a near doji candle last week. Note that the low of the bullish reversal candle at 1.0268 has held, so it is quite likely to act as support given the general bullish trend.
Let’s take a closer look now at the daily chart:
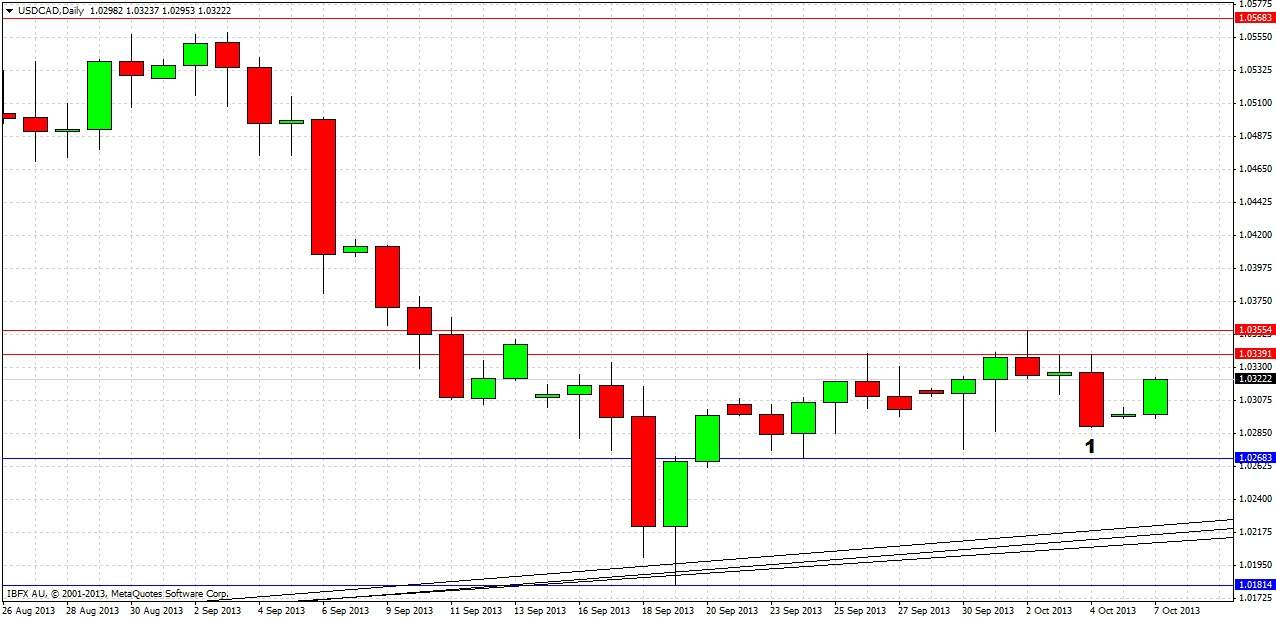
We can see that short-term resistance was established by both last week’s high at 1.0355, and the high of Friday’s bearish reversal candle (marked at 1) at 1.0339. Support is at 1.0268.
The first thing to watch out for is whether we get a daily close next below 1.0268 or above 1.0355. This should be the most straightforward way to determine the direction of the next likely major move.
Aggressive traders could go long at a retest of 1.0268, provided that this happens before the price reaches 1.0355.
The default bias should still be bullish.


