Our previous analysis about one and a half weeks ago ended with the following forecast:
1. Difficult to make any confident predictions.
2. Possible long trade if price falls rapidly to confluent area of both the lower triangle trend line and the higher trend line of the previous bearish channel.
3. Possible short trade from any well-defined reversal from the upper triangle trend line.
4. Possible short trade from any return to the zone from 100.40 to 100.60.
As it happened, none of the events described above came to pass, so none of the predictions were tested.
Let's start looking to predict what might happen over the coming days by taking a look at the weekly chart first:
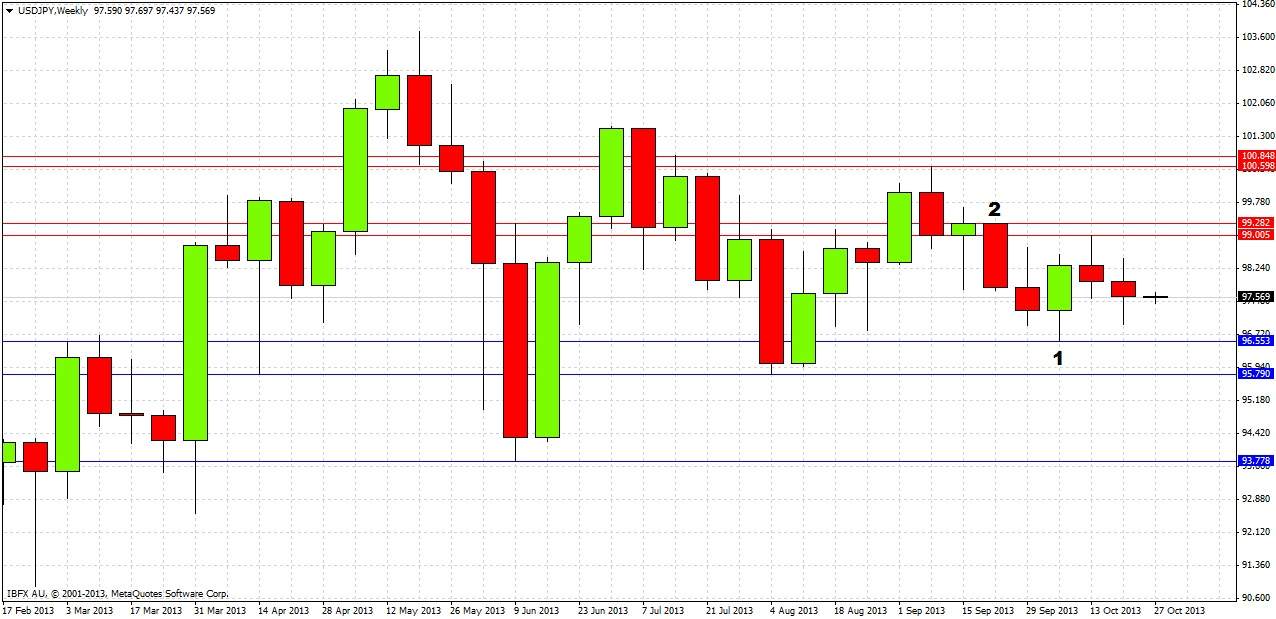
The price has been consolidating since May in a fairly triangular style. We will take a closer look at triangular trend lines that can be applied in a shorter term chart to follow. For now it is enough to analyse major S/R levels and the price action of the weekly candles.
Three weeks ago there was a bullish reversal candle that closed close to its high marked at (1). The low of this candle produced a major swing low at 96.55 which has still not been broken, so this can be marked as a major support level. There is another major support level not far below that at 95.79.
Although this bullish reversal candle’s high was broken the next week, this just printed another swing high from which the price has been falling off ever since, so we can mark this swing high as significant resistance. This level is also confluent with a round number at 99.00.
Two weeks before the bullish reversal candle, there was a strong bearish reversal candle marked at (2). The high of this candle at 99.28 has held since then so this level can be added as major resistance, giving more weight to the 99.00 level to which it is very close.
The week just passed printed a bearish candle, but it is rather weak and indecisive, and is not showing right now enough momentum to look like breaking out of the area between 96.55 and 99.00.
Let’s now take a closer look with the daily chart and include some significant trend lines and daily S/R levels:
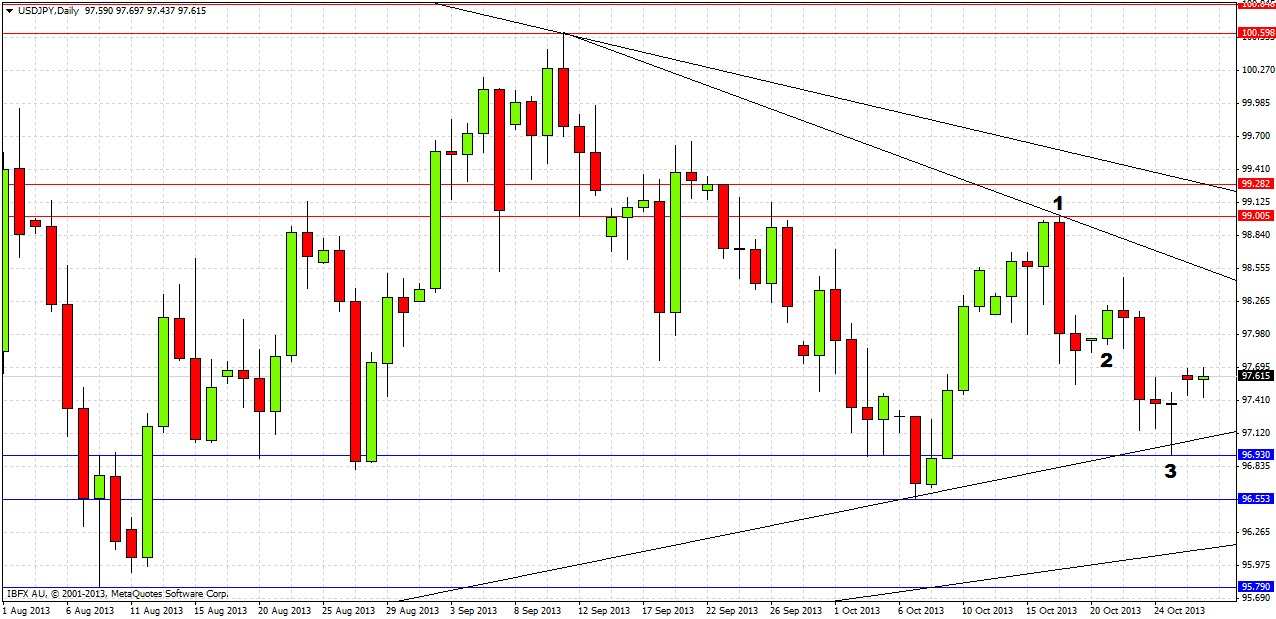
We can draw some long-term triangular trend lines. It can be seen there is a little ambiguity as there are two lines for each edge of the consolidating triangle, however it is clear the higher trend lines in both cases look more reliable and should be used for entries, whereas the other trend lines are less reliable and should be used as conditional warnings. The longer until the higher of the lower trend lines is tested, the better it should hold.
Turning to the price action, the week before last there was a strong bearish reversal candle marked at (1), establishing the high at 99.00 we saw on the weekly chart. A few days later, marked at (2), we saw a bullish reversal candle that failed quickly, as bearish momentum was re-established. Last Thursday and Friday were very significant, producing an inside candle followed by a pin candle marked at (3) off the more reliable, long-term lower triangle trend line. This is a bullish sign and should push the price up to the wring high at around 98.50 before any retest of 96.93.
Therefore the predictions that can be made now are as follows:
1. A bullish bias right now, with the price heading for 98.50 before any successful retest of 96.93.
2. The higher of the triangle trend lines on both edges are likely to be the most reliable trend lines.
3. A sustained break above 99.28 will be a very bullish sign.
4. A sustained break below 96.50 will be a very bearish sign.
5. Possible to short any reversal off the 100.40 to 100.60 zone.
6. Market focus has recently moved away from this pair and towards the risk/USD currency pairs.


