Our previous analysis last Thursday ended with the following predictions:
1. If the week closes well below the lower trend line of the triangle, this is a bearish sign.
2. If 96.78 is significantly broken to the down side, then that is a bearish sign.
3. If the lower trend line of the bearish channel is not respected, that is a bearish sign.
4. It is worth paying attention to the trend lines for the best trading opportunities.
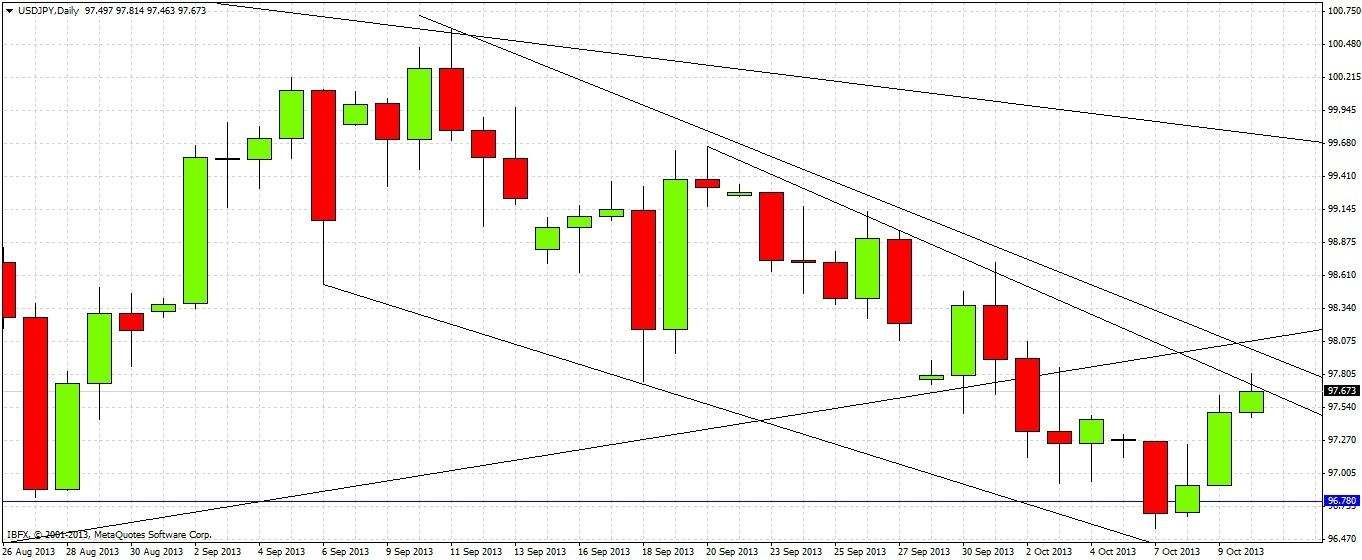
Let's look at the daily chart to see what has actually happened since then, and measure it against our predictions:
Last week actually closed at 97.27, which was 75 pips below the lower trend line of the triangle, so this was a bearish sign. This Monday we had a daily close a little below 96.78, although the price did not remain down at that level for long. The lower trend line of the bearish channel has been respected. So we had only one bearish sign, and that has been fair enough as the action since our last analysis has been mixed, first bearish, then bullish.
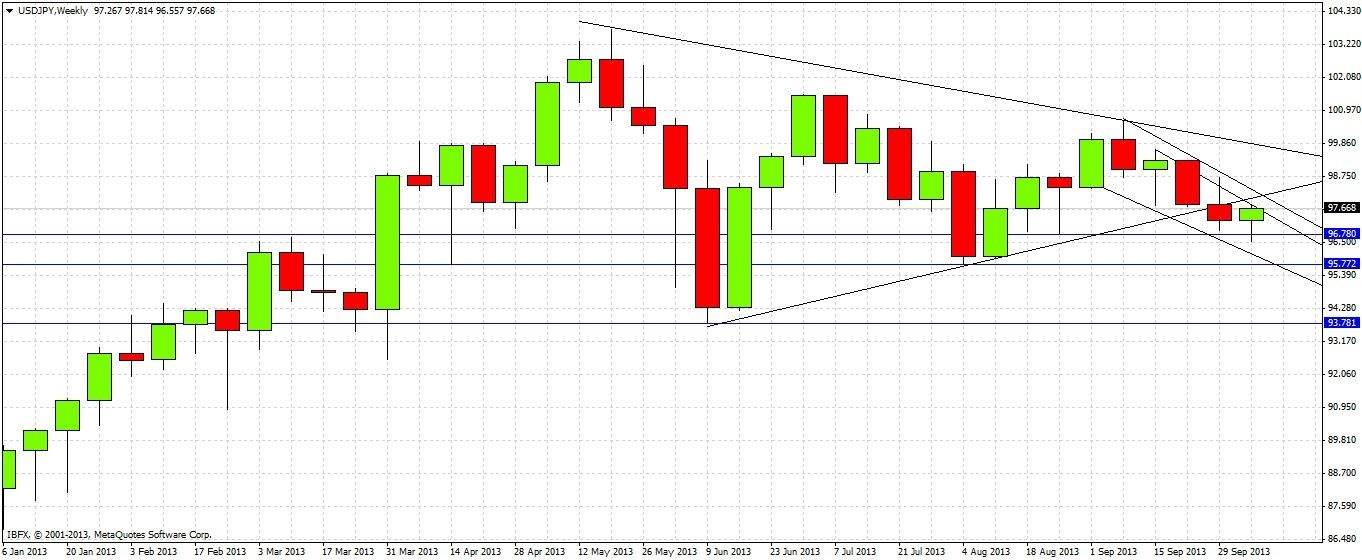
Turning to the future, let’s take a look at the weekly chart below
As was already mentioned, last week closed bearishly, breaking the lower triangle trend line. This week so far we see that the price has bounced bullishly from a bit below the support level at 96.78 to challenge an approach to the upper trend line of the bearish channel, which has held so far.
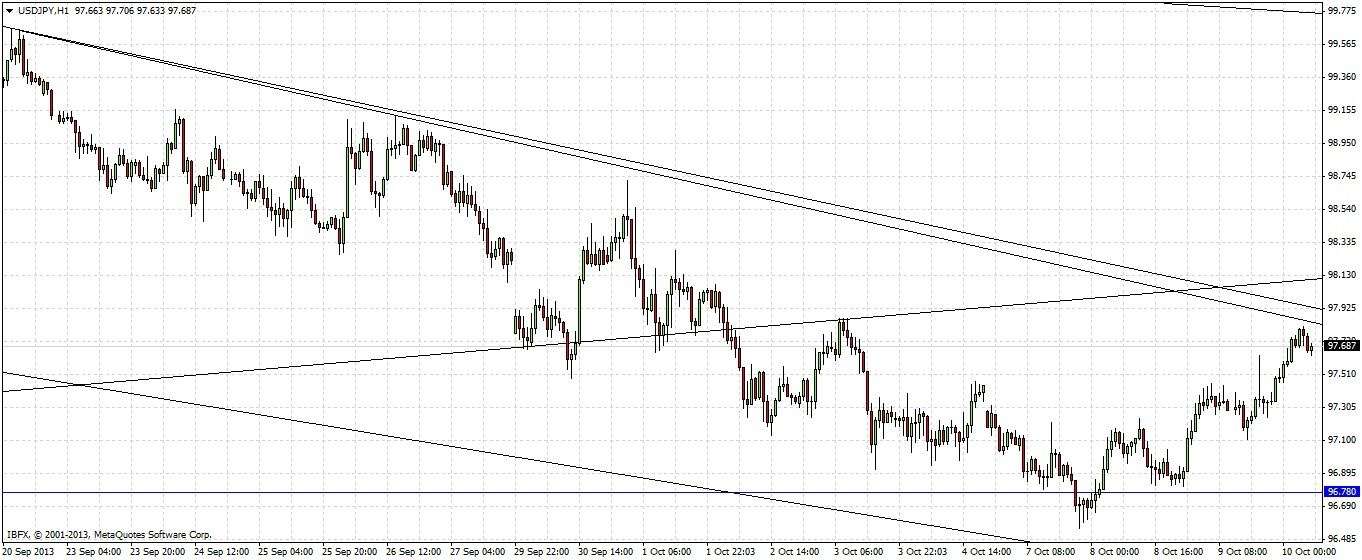
It is helpful to be very precise with these trend lines, so let's drop down to the 1 hour chart so we can see precisely where they run:
This pair is respecting the important longer-term trend lines, and for now it seems like we are in an area where there can be good shorting opportunities. Even if the upper channel trend lines are not respected, we have not far above that a possible retest of the lower trend line of the previous triangle.
The wise move should be to fade the trend lines, or any close approaches to them, with suitable stops. At the current moment, it seems possible that a good short trade could arrive from any bearish reversal candle on a short-term chart such as the 1 hour chart.
A breakout above the upper channel trend line should lead to a retest of the triangle. If the price can break through the lower triangle trend line, that would be a very bullish sign. Conversely, a break down through the lower bearish channel trend line would be an extremely bearish sign.


