Our previous analysis last Thursday ended as follows:
1. First approaches to any of the trend lines marked on the charts should be faded
2. A retest of the lower triangle trend line should be an especially good short trade opportunity
3. A breach of the lower triangle trend line to the upside will be a very bullish sign
4. A breach of the bearish channel’s lower trend line to the down side will be an extremely bearish sign
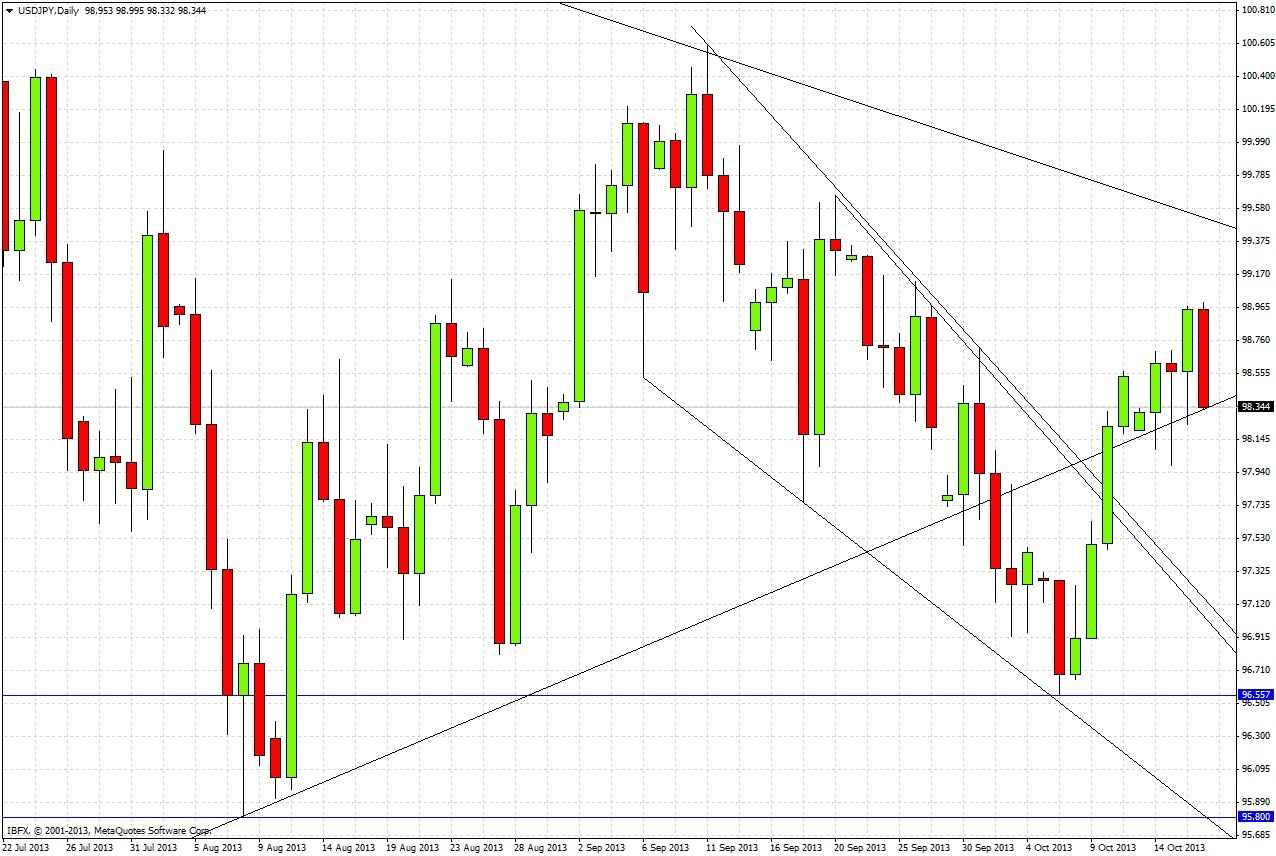
Let's look at the daily chart to see how things have transpired, and measure that against our predictions:
Both the upper trend lines of the bearish channel, and the lower trend line of the triangle, were quickly breached to the upside. Fading either of these first approaches would not have produced successful trades. The best that can be said is that there were no bearish reversal formations on any 1 hour chart, so traders looking for that kind of confirmation would have stayed out of trouble.
On the plus side, it was forecast that the breach of the lower triangle trend line to the upside would be a very bullish sign, and we have had some bullish action since this occurred, although the jury is really still out on this one following the fall last night. We will need some more time to see what will transpire.
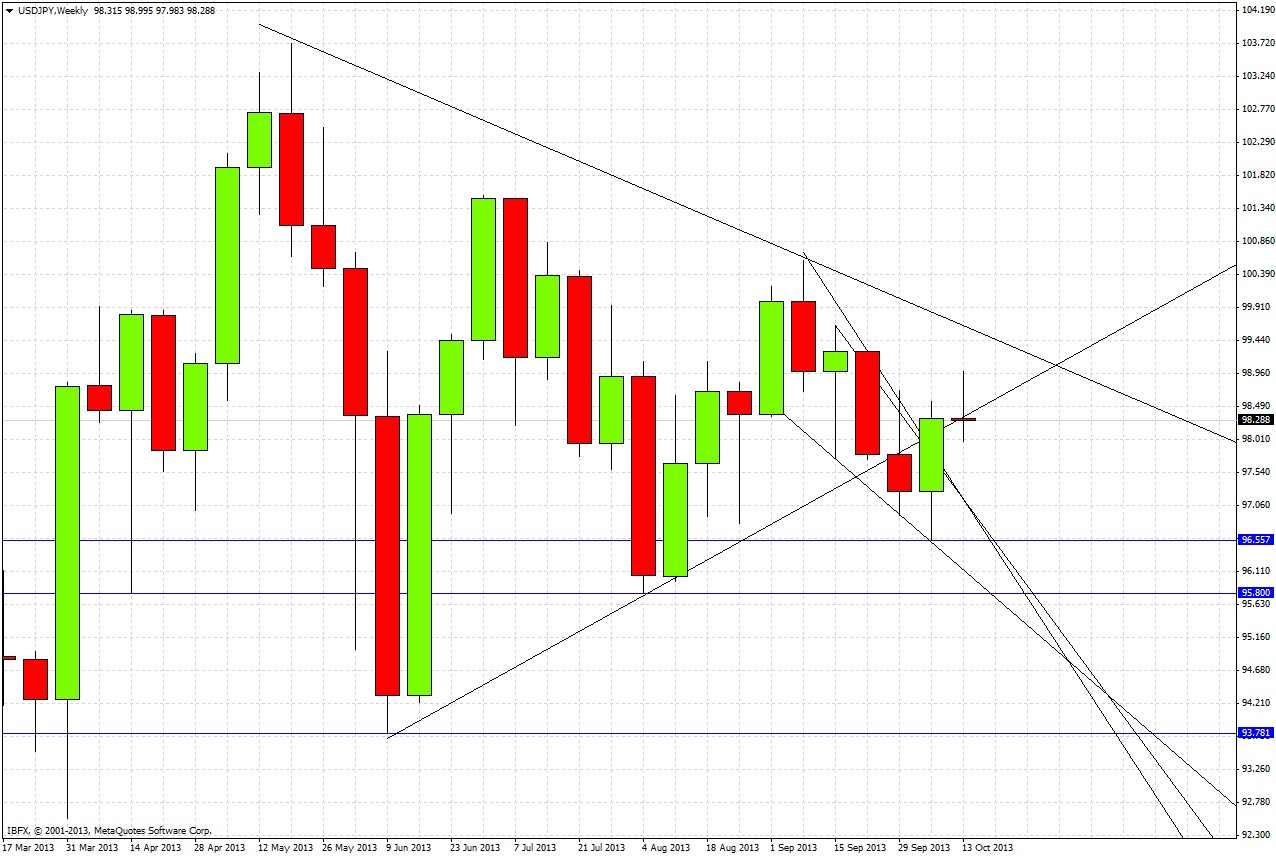
Turning to the future, let’s take a look at the weekly chart below
Last week was a bullish reversal bar, closing just above on the lower trend line of the triangle that was broken down to the downside last month. This week is bullish so far and has penetrated back into the triangle. The bearish channel that had developed over the previous month was broken to the upside strongly and easily. These facts suggest two analytical courses of action will probably be wise:
1. We can redraw the triangle to include the summer’s range, leaving the upper trend line from the previous triangle intact. A new lower tend line will be drawn from the June low through to the September low, and will be reflected in the daily chart to follow. A retest of the upper trend line of the previous bearish channel, while a little ambiguous, may also prove useful so we will leave that in as well.
2. We should give more weight to candles reflecting supply and demand areas rather than trend lines, so we can forget any other trend lines except the wide triangle previously mentioned.
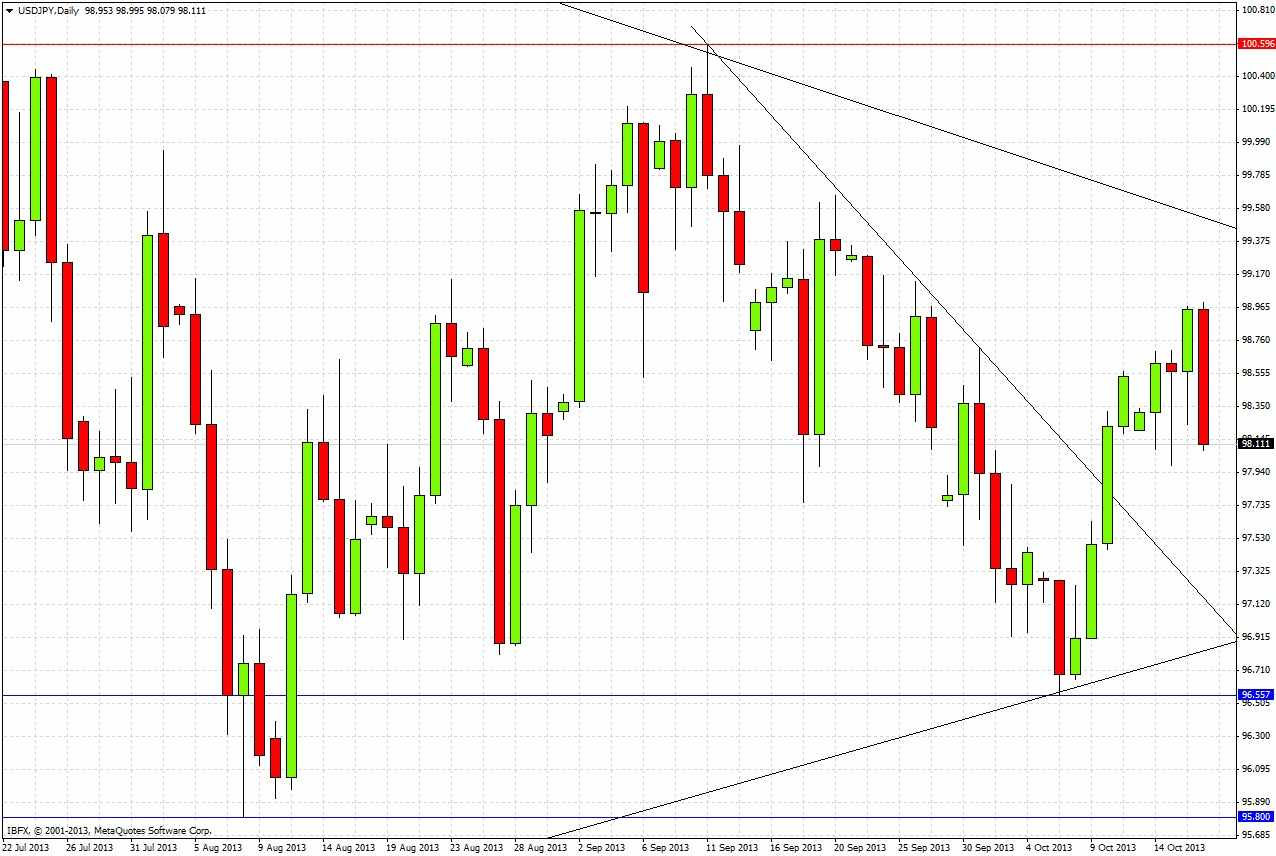
Let’s turn to the redrawn daily chart now for a more detailed look at the situation
It is hard to make any predictions with confidence. Look at the chart above to see how, despite the trending nature of recent movements, price action has been somewhat choppy and supply and demand unpredictable from conventional candlestick analysis.
The only potential trades that look high-probability right now would be:
1. A long from a conjunction of the lower triangle trend line and the upper trend line of the previous bearish channel, but it is unlikely that the price will fall quickly enough to meet that conjunction.
2. A short from a well-defined bearish reversal from the upper triangle trend line, as this trend line has held so far.
3. A short from the zone between 100.40 and 100.60, although we are a long way away from there right now.
Otherwise it is probably going to be better to watch and wait for new developments. Despite the bullishness of last week's candle, the triangular nature of the price action suggests it is better to have no bias.


