Last 's Thursday's analysis ended with the following significant comments:
1. Hard to predict the likely next move, no overall bias
2. A period of weak bullishness / consolidation is likely
3. A sustained break below 1.3440 is required to take a confidently bearish bias. This could see the price descend all the way to 1.3100
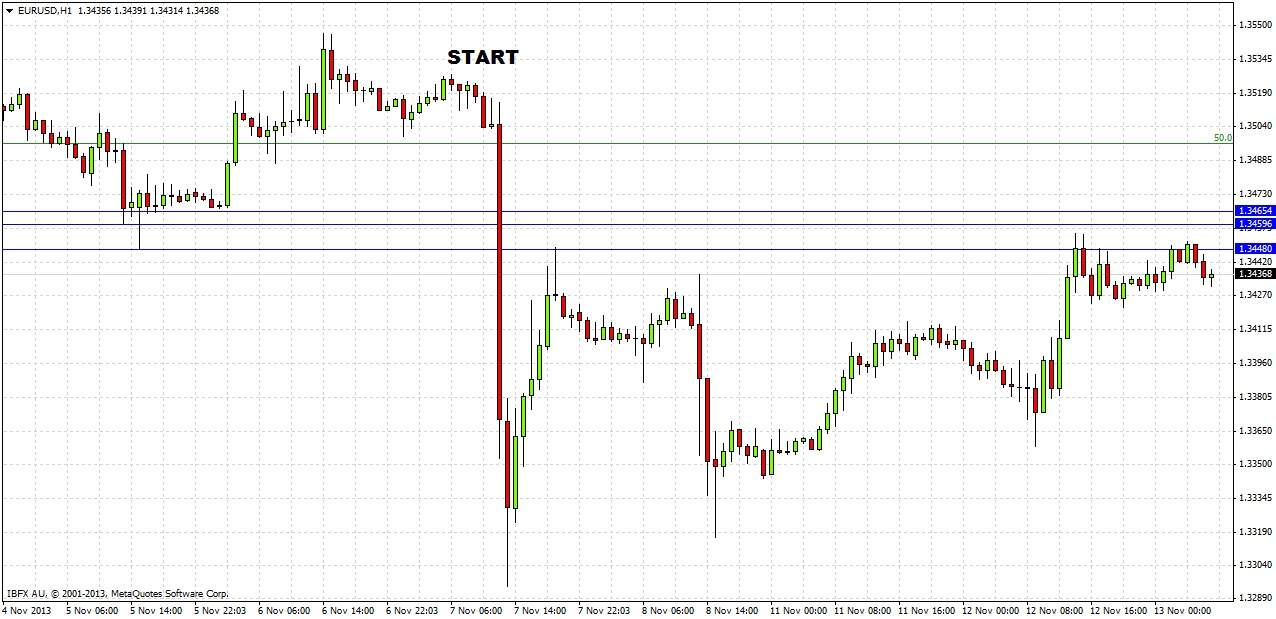
Let's take a look at the hourly chart to see how things actually turned out:
As it happens, the surprise rate cut by the ECB drove price down sharply to just below 1.3300, but there has been a bullish recovery since then which is now stuck at the former support zone from 1.3440 to 1.3465, which seems to have turned into resistance. So, there has been some weak bullishness, but not in the area expected, as the break below 1.3440 should have led to a further fall. It all goes to show how fundamental changes such as a surprise rate cut can lead to surprising technical consequences.
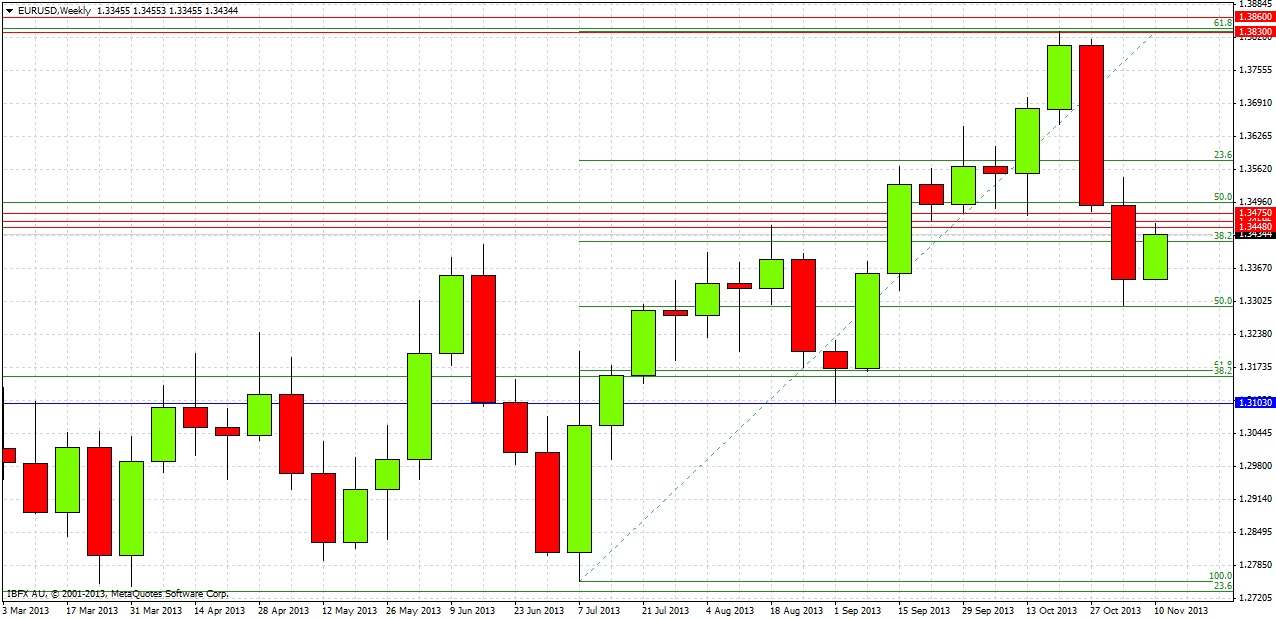
Turning to the future, let's take a look at the weekly chart below:
Last week produced a bearish candle that closed not far from its low. The action has broken below the S/R zone and has so far been unable to break back above 1.3440. However, there has been an interesting new development: drawing a new Fibonacci retracement on the upwards move from July to October (as shown in the chart above), we can see that the sharp move down after the ECB rate cut hit the 50% retracement level practically to the pip.
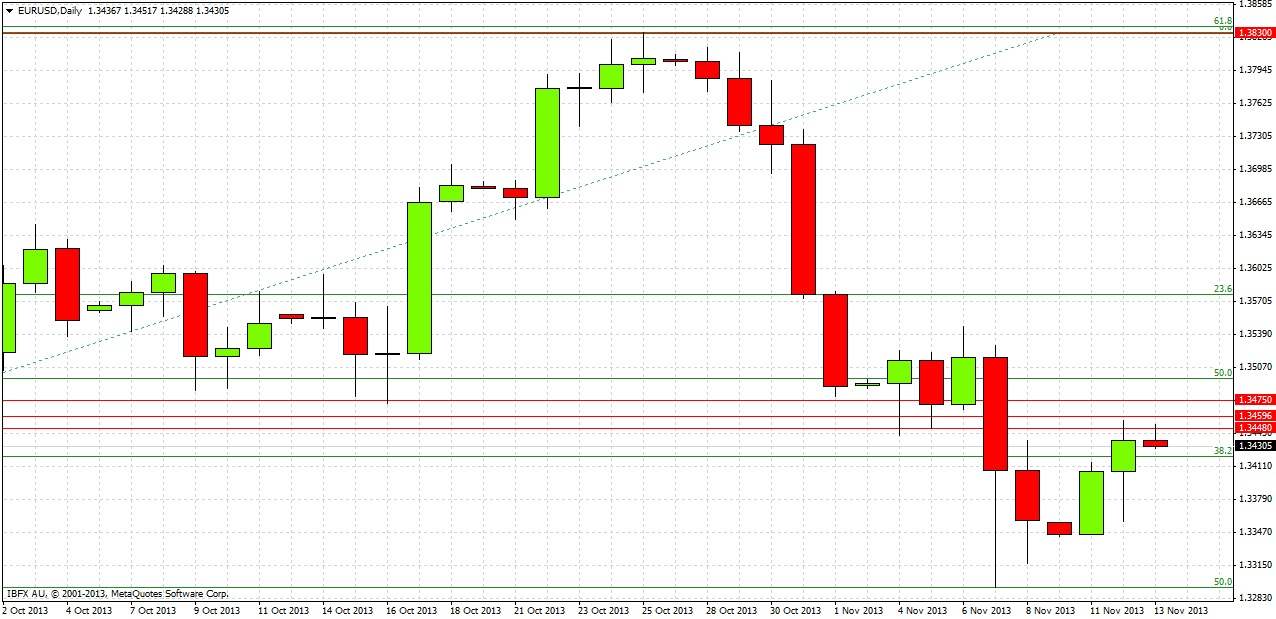
We can see this in more detail on the daily chart below:
The large daily candle that broke down to the 50% Fibonacci retracement was the day of the surprise ECB rate cut. It is notable that the rate cut did not have a greater and more sustained bearish effect, with the day of the cut only closing about halfway down its range, and the action subsequent to the cut being all bullish up to the support turned resistance from 1.3440 to 1.3465. Since the day of the rate cut, the action has been confined to that day’s range.
The following observations and predictions can be made:
1. The confluent round number and 50% Fibonacci retracement at 1.3300 should prove to be strong support.
2. What was strong support between 1.3440 and 1.3465 seems to have turned into strong resistance.
3. A sustained break of 1.3300 to the down side will be a very bearish sign and should lead to the price touching close to 1.3100.
4. A sustained break of 1.3475 to the up side will be a bullish sign, but even after this the price is quite likely to consolidate around 1.3500 for a while, in the absence of any significant news.
5. A long touch trade can be taken at the first retest of 1.3300 during a London session.
6. A short trade can be taken off a strongly bearish short-term candle closing below 1.3440 provided that 1.3475 has not been significantly breached, however the move down will probably be choppy if this happens today.
7. No strong overall bias.


