Last Wednesday's piece ended with only a single prediction that has been relevant to the price action that has taken place since then:
1. Over the short term, a close today above 1.6075 should signal a rise to at least 1.6150 or thereabouts.
Although the price did close just a few pips higher than 1.6075, the action was in fact primarily bearish, not rising higher than 1.6113 at any time. This forecast was proved to be wrong.
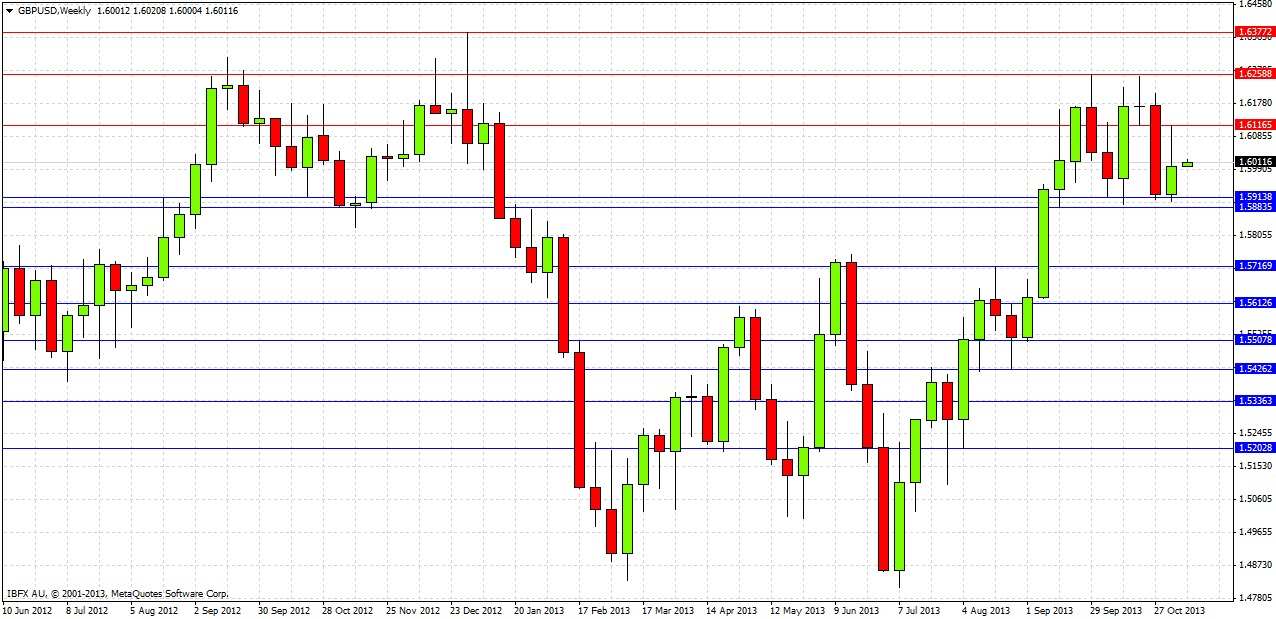
Looking to the future, let's start by taking a look at the weekly chart:
Last week’s candle just broke last week’s low by a few pips, then rose weakly, closing in the lower half of its range. It is an indecisive candle, showing that despite the strong support, the price has been unable as yet to rise with any real strength.
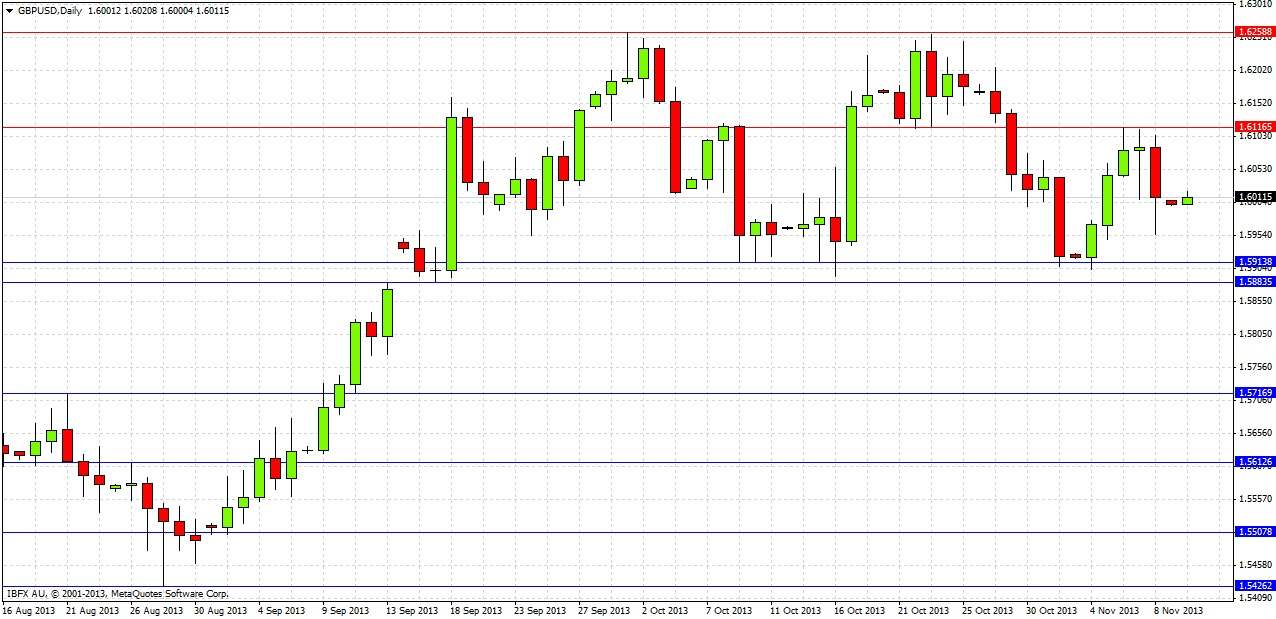
Let’s turn to the daily chart now:
Wednesday produced a weakly bullish candle that made last week’s high at 1.6117. What is significant is that this high is almost the same level - to the pip - that was acting as support from 21st to 28th October, so it seems this support level has turned into resistance, as the action was primarily bearish last week after this level was touched. The following day the price fell, before rising to produce a pin bar, but on Friday the pin bar’s high was not exceeded although its low was, although we did get some rebound off the low.
Overall then it is clear that the only significant development is the affirmation of resistance at 1.6113, and that as was stated in the previous analysis, “It is clear the price is now trapped between strong resistance and support zones about 350 pips apart.”
Therefore it seems logical to stick with mostly the same conclusions and as before:
1. No overall directional bias, until there is a sustained break above 1.6250 (bullish) or below 1.5885 (bearish).
2. Touch trades possible during London sessions: long at 1.5900, short at 1.6250.
3. A sustained break of 1.5885 to the downside should send price down to 1.5750 fairly quickly and possibly beyond.
4. A sustained break of 1.6250 to the upside will have unpredictable consequences until 1.6377 is surpassed, which would be an extremely bullish sign.
5. A sustained break of 1.6113 would be a mildly bullish sign.


