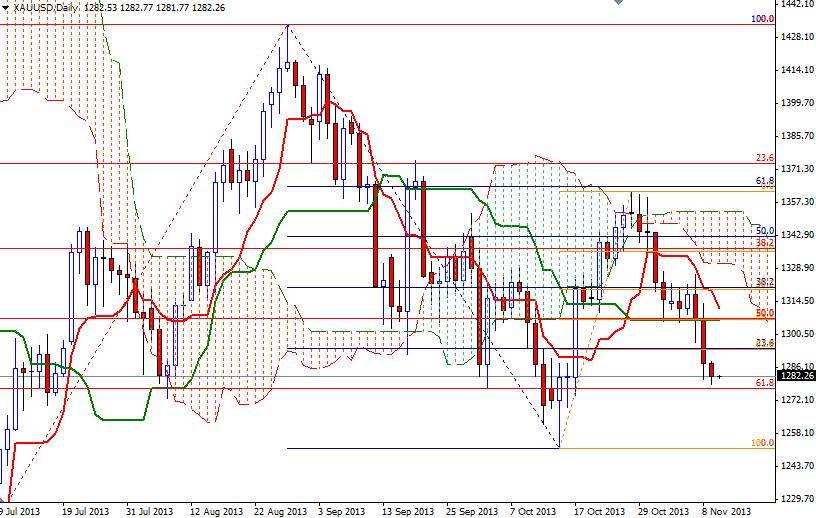
The XAU/USD pair continued to sink during yesterday's session and closed the day at $1282.57 an ounce, the lowest level since October 16. There is no doubt that U.S. non-farm payrolls figures were better than forecasts. Since majority of market participants had been expecting the government shutdown to distort the data, surprisingly strong numbers (including revisions) helped push gold towards the 1277 support level which also happens to be the Fibonacci 61.8 retracement level based on the bullish run from 1180.21 to 1433.70. Recently, prices have been suffering due to weakening demand for the precious metal as a hedge against financial turmoil or inflation. It appears that market players continue to shift money from gold to equities and American dollar.
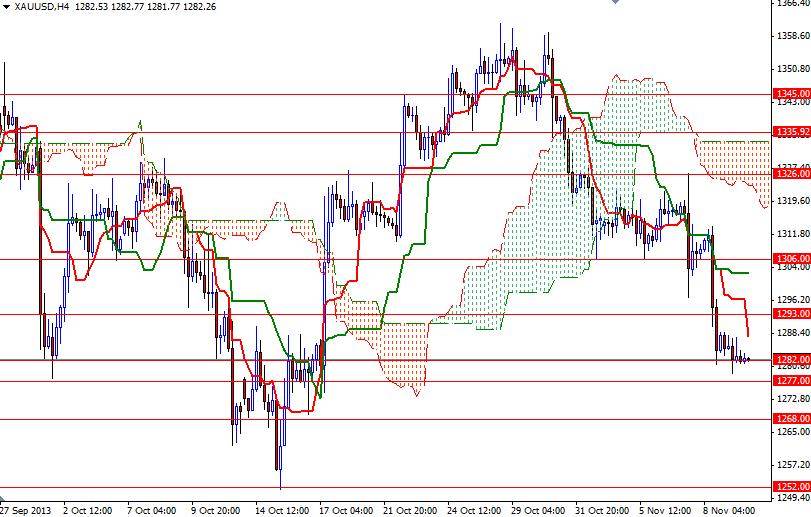
The XAU/USD pair printed lower highs and lower lows 3 days in a row. On the weekly, daily and 4-hour time frames, the pair is trading below the Ichimoku clouds. In addition, we have bearish Tenkan-sen line (nine-period moving average, red line) - Kijun-sen line (twenty six-day moving average, green line) cross on the 4-hour chart. Until this technical outlook changes, buying gold at these levels would simply be a risky gambling.
Today the key levels to watch will be 1277 and 1293. The bulls will need to push the pair above the 1293 in order to test the next barrier which currently sits at the 1306 level. Beyond 1306, I expect to see more resistance between 1319 and 1326. If the 1277 support level gives way, it is technically possible that the XAU/USD pair will continue its bearish tendencies. In that case, the bears will try to reach the 1268 level first. A daily close below 1268 would suggest that the 1252 support level will be the next target.


