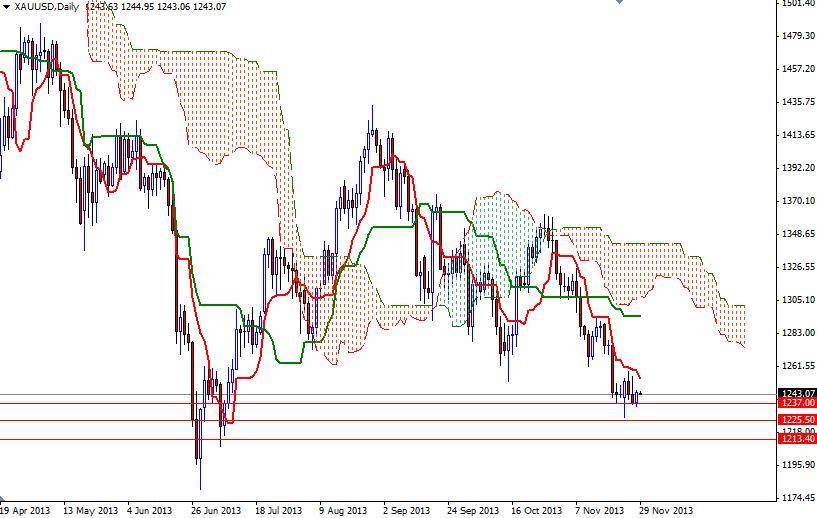
Gold market was predictably calm while the United States was on holiday. Although the pair has been suffering from weakening demand for physical gold since beginning of the month, the trading action is getting tight recently. So far, the support level at 1237 seems to be holding but rebounds are getting weaker as the perception that the major stock markets will continue to rally is depressing the attractiveness of safe-haven gold. In order to see the degree of pressure, we should also look at the XAU/EUR and XAU/GBP pairs. Just a couple of days ago both pairs hit the lowest levels since August 2010.
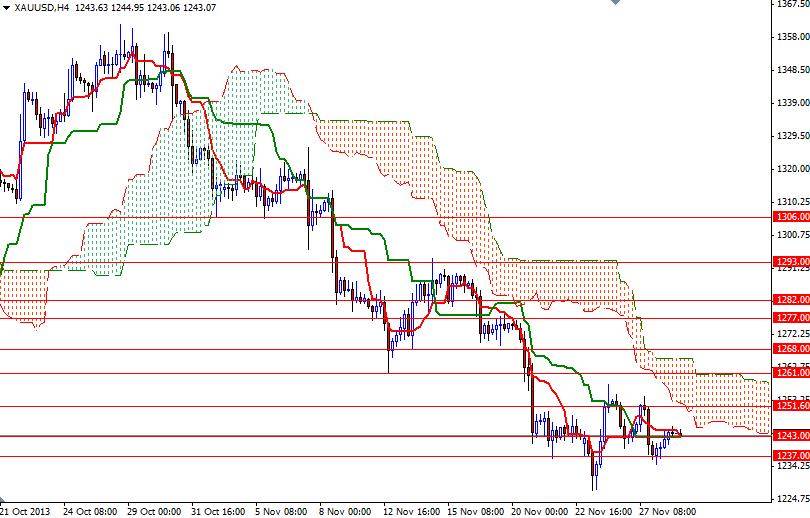
Technically speaking, the bulls will be struggling to gain strong traction while the XAU/USD pair is moving below the Ichimoku clouds on the daily chart. From an intra-day point of view, resistance to the upside can be found at 1252 which happens to be the Tenkan-sen line (nine-period moving average, red line) on the daily chart. If the pair successfully climb above that level, it is likely that it is likely that the pair will test the 1261 level where the upper band of the Ichimoku cloud resides on the 4-hour time frame.
Beyond that, expect to see strong resistance at the 1268 level and I think this level is a strategic point for the bulls to conquer before they can march towards the 1293 resistance. On the other hand, a break below the 1237 would indicate that the bears won't give up before we retest 1225.50. Closing below 1225.50 could trigger another sell off which may drag prices down to 1200.


