Our previous analysis one week ago included the following forecasts relevant to the price action that has occurred since then:
1. The long-term uptrend remains intact but is called into question if we will not break above 1.0500 soon.
2. If the bearish trend line holds for a few more days, we will get a break below 1.0462 and the price will fall towards 1.0400.
3. Partial profits should be taken on any existing long trades taken at or near 1.0400.
4. Risk should have been taken off any existing short trades entered at the trend line by now.
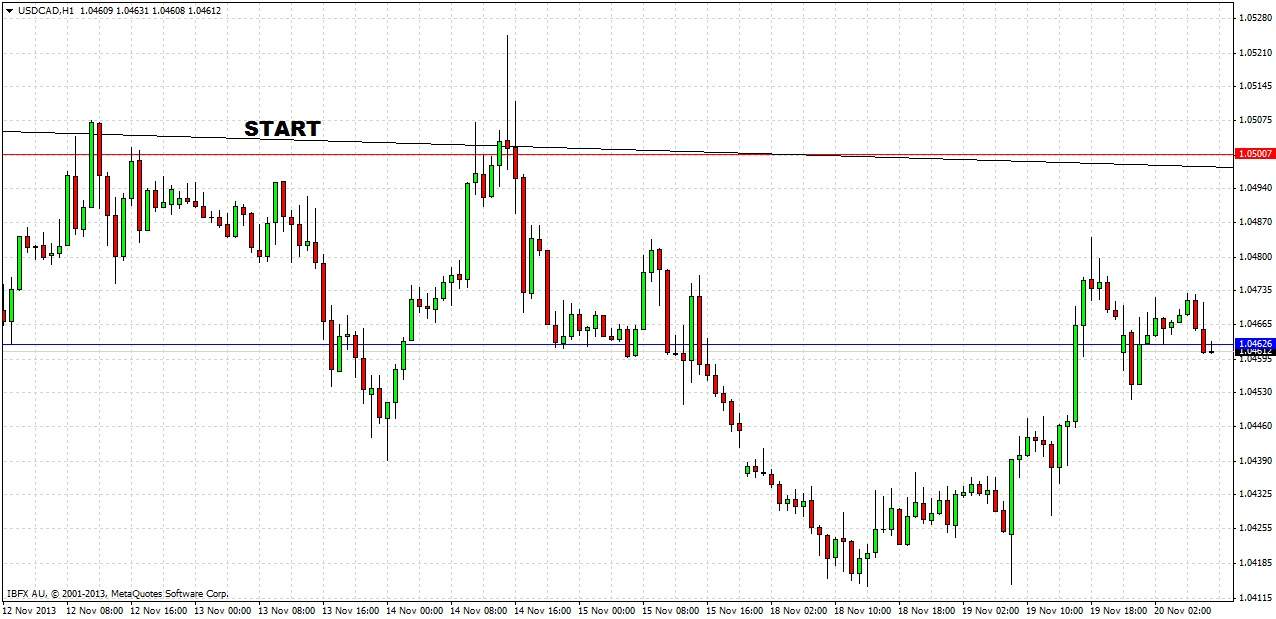
Let's look at the 1 hour chart to see how things have developed over the past week:
The prediction worked out almost perfectly:
1. We were unable to break 1.0500 with any conviction, and so made another significant lower high, calling the uptrend into question. However, it is too early to say the uptrend is over.
2. The bearish trend line (seen sitting just below “START” in the above image) did indeed hold, and the price broke 1.0462 and almost reached 1.0400.
3. Taking partial profits on any long at publication would have been a relatively good exit point compared to subsequent price action.
4. Taking off risk would have been a good move as the previous high was subsequently broken, which would have triggered any tight stop losses.
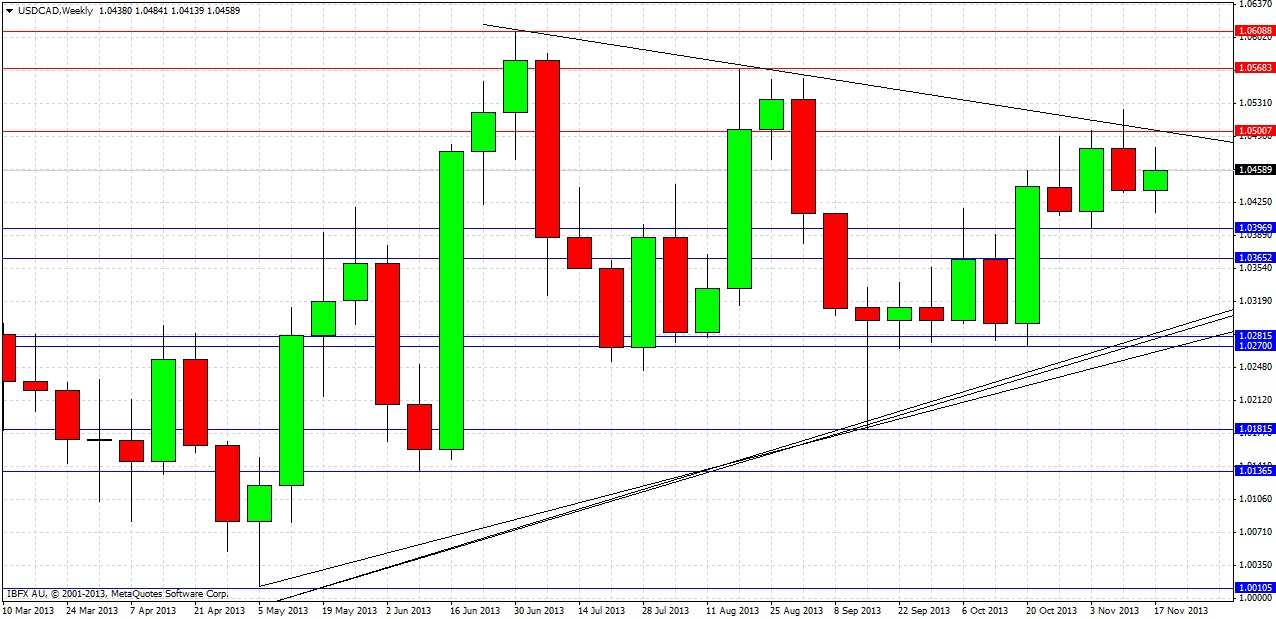
Turning to the future, let's begin with a look at the weekly chart:
Last week printed a bearish candle, closing hard on its low. It also made a third touch and rejection of a major bearish trend line. All in all it is a bearish story; last week’s low has already been broken, although we still have not broken the low of the last bullish reversal candle just below 1.0400.
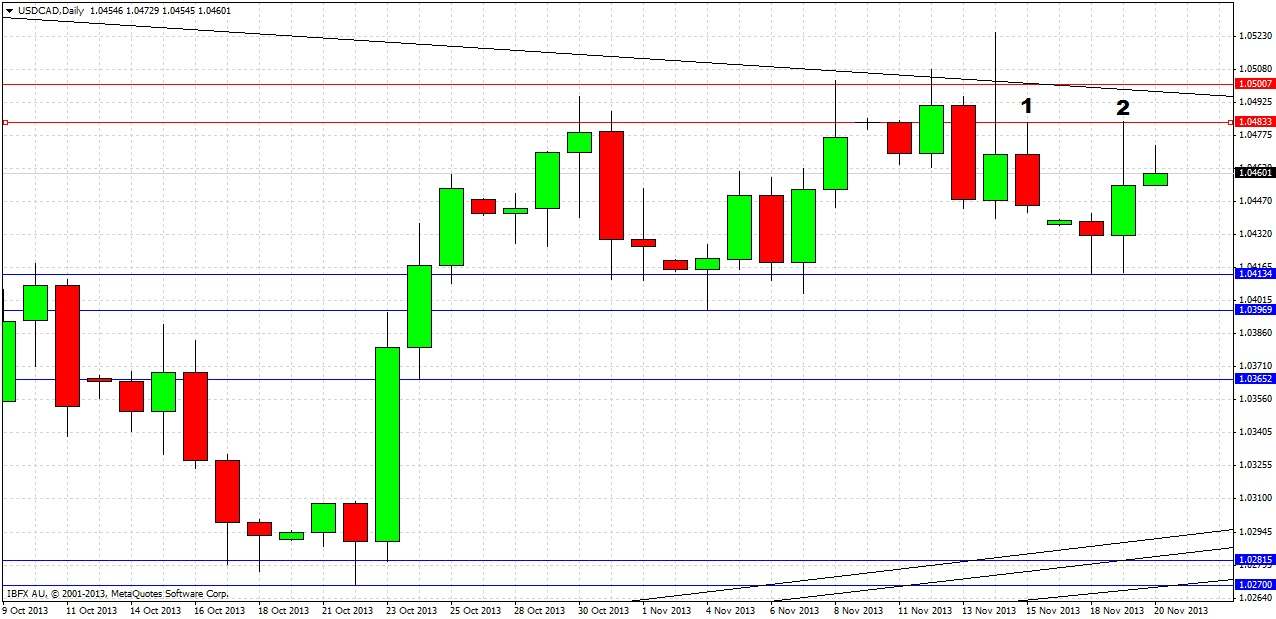
We should be able to get some more detail by taking a close look at the daily chart:
We can see there have been two recent daily rejections of the bearish trend line above, increasing the bearish emphasis. Following the second rejection, there was a bearish reversal candle marked at (1), and the price then gapped down over the weekend before printing a double bottom at 1.0413. There was a bullish reversal candle formed after the second bottom marked at (2), which immediately formed a double top by rejecting the resistance level at 1.0483.
This printing of higher support and lower resistance shows we are currently stuck in a fairly narrow range between 1.0413 and 1.0483.
Our summary and forecasts therefore are as follows:
1. The long-term uptrend remains intact but is called into question. It seems there is most opportunity on the bearish side now, and we recommend holding onto any shorts as long as the bearish trend line holds.
2. A sustained break of 1.0483 will be a mildly bullish sign and will probably lead to a test of 1.0500.
3. A sustained break of 1.0500 will be a very bullish sign and would suggest a bullish surge towards 1.0565.
4. A sustained break of 1.0413 will be a mildly bearish sign and will probably lead to a test of 1.0400.
5. A sustained break of 1.0400 will be a bearish sign.
6. A sustained break of 1.0365 will be a very bearish sign and will probably lead to a test of the lower trend lines.
7. If neither 1.0413 nor 1.0483 is hit today, either could be productive scalp touch trades at the first test of one of them tomorrow or later.
8. Another decisive rejection of the bearish trend line could be another good opportunity to go short.


