Our previous analysis last week closed with the following recommendations and predictions, as applicable to the price action that has occurred since then:
1. If there is a successful breakout past 99.28 that holds for a few hours at least, that will be a bullish sign. The target then would be the 100.00 to 100.40 zone.
2. If an overall bias has to be chosen, it should be bullish, but we are taking no bias.
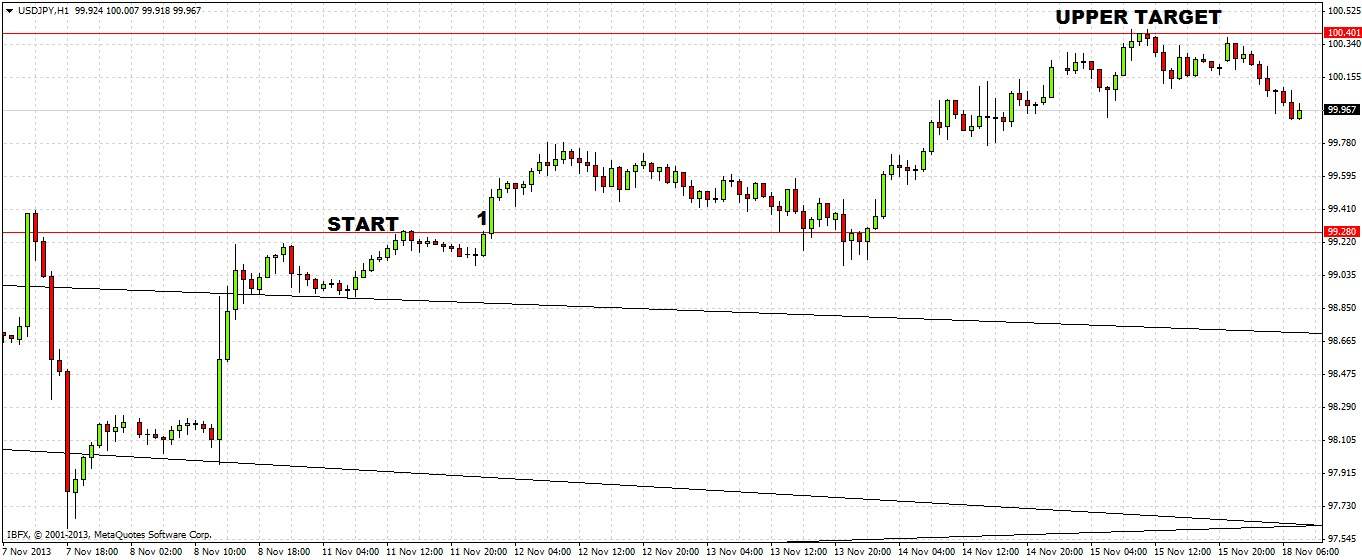
This was an excellent forecast, but we erred in not being bullish enough. The break of 99.28 marked at (1) on the below chart was decisive, and after pulling back, rose to 100.42 before falling back. The target was called correctly:
Turning to the future, let's begin with a look at the weekly chart:
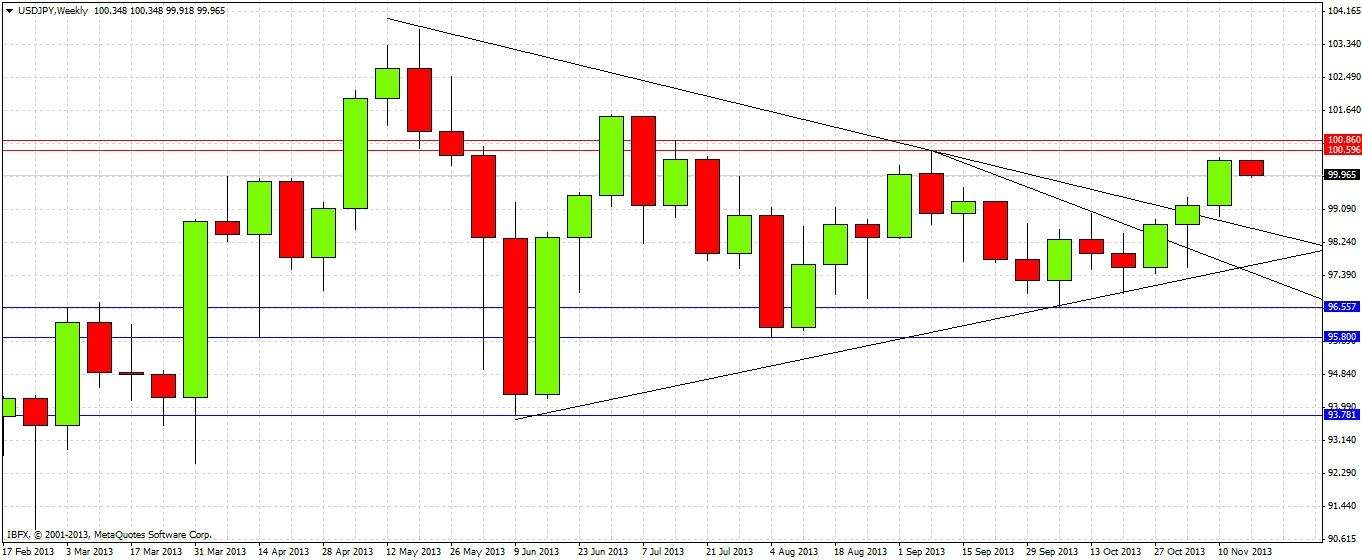
The chart shows clearly that there has been a bullish breakout of the long-term triangle. The last two weeks have produced very bullish candles following the bullish reversal candle of three weeks ago. However the price has now paused close to the long-term resistance zone from 100.60 to 100.86.
Let’s take a look at the daily chart for more detail:
We can see at (1) that a bullish reversal bar was made after a bearish inside day. Note how the first few days of last week saw support kicking in at around the 99.00 level or just above it, leading to the move up. The bullish reversal candle's high was broken the next day, but the price found resistance at 100.42 and has been falling today.
The chart is telling an undoubtedly bullish story. The big question is whether the price can break through these long-term resistance levels that lie just above at 100.42, 100.59, and 100.86.
Therefore the following conclusions can be drawn:
1. The price may well find it hard to break through any or all of these resistance levels: 100.42, 100.59, and 100.86, so high reward to risk short trades are possible if we test those levels, the sooner the better.
2. If the price makes a sustained break above 100.86, that will be a very bullish sign, and it should go on to reach 101.50.
3. There is bullish momentum but the price may well pull back before it can break through resistance. If so, 99.11 should act as strong support, and long trades are possible off shorter-term bullish reversals below 98.50, the closer to 99.00 the better.
4. If the price falls below 99.00 it may retest the broken upper trend line, this would not be very high-probability but could be a worthwhile long touch trade. Ditto regarding the trend lines below that.
5. Bullish bias insofar as there should be most profit potential on the upside.


