Our previous analysis last week closed with the following recommendations and predictions, as applicable to the price action that has occurred since then:
1. The price might find it hard to break through any or all of these resistance levels: 100.42, 100.59, and 100.86, so high reward to risk short trades are possible if we test those levels, the sooner the better.
2. If the price makes a sustained break above 100.86, that will be a very bullish sign, and it should go on to reach 101.50.
3. There is bullish momentum but the price may well pull back before it can break through resistance.
4. Bullish bias insofar as there should be most profit potential on the upside.
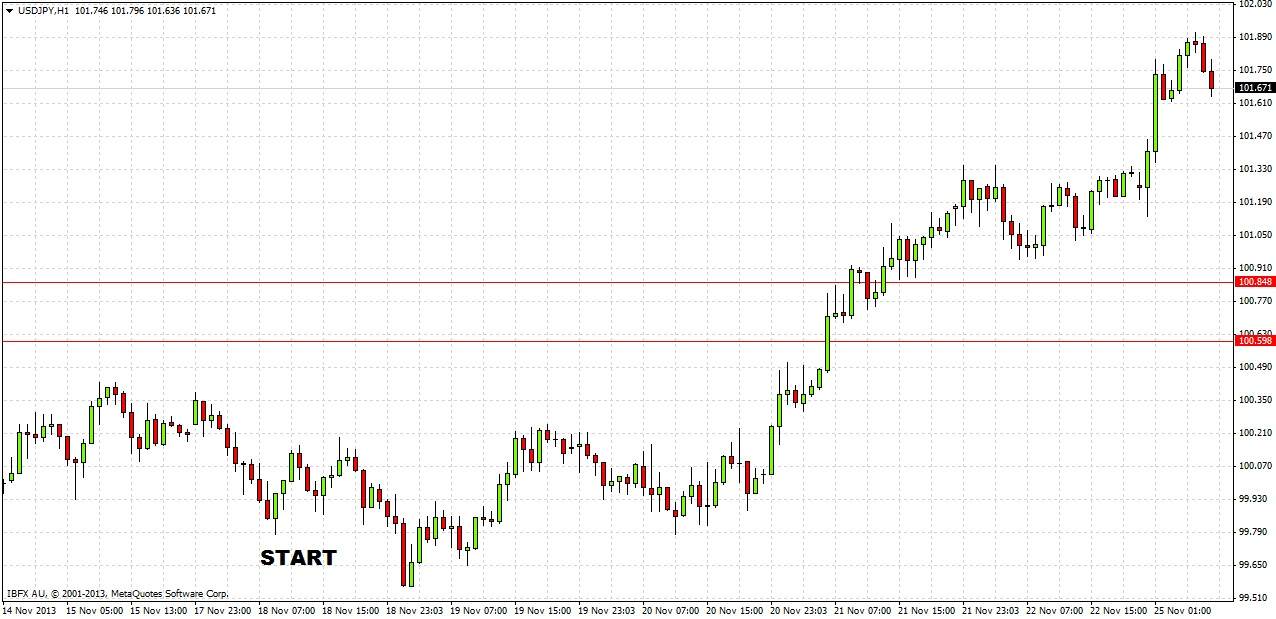
Let’s see how things worked out since then on the 1 hour chart below:
Taking each prediction in turn:
1. This was incorrect; none of these levels offered any real substantial resistance.
2. This was correct; the price has already surpassed 101.50.
3. This was correct, there was a pullback the day after the forecast, and then a further pull back the next day, before the sustained upwards move began.
4. Our bullish bias was undoubtedly correct.
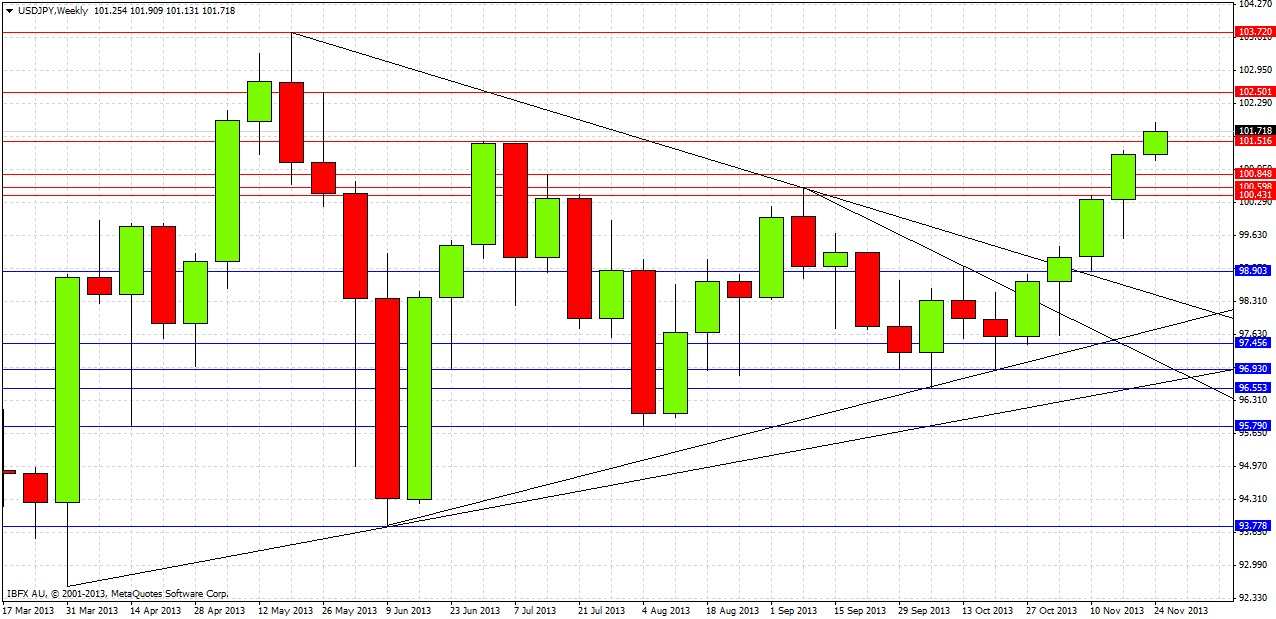
Turning to the future, let's begin with a look at the weekly chart:
Last week produced a bullish candle closing right on its high, and well above the previous week’s high. The action easily cut through the resistance levels from 100.42 to 100.84. Since the weekly open last night we have already broken, with momentum, the resistance level of 101.50. The bullish breakout of the long-term triangle has followed through with strong momentum following a retest of the broken trend line.
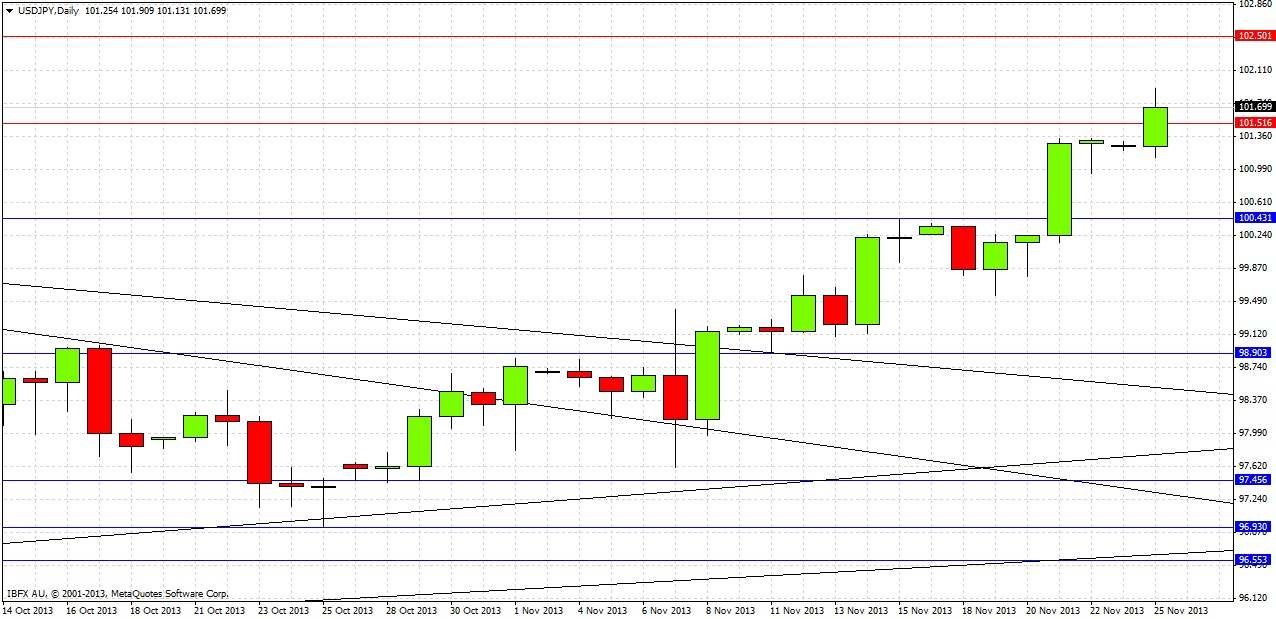
Let’s take a look at the daily chart for more detail:
The daily chart shows that apart from the pullback on Monday last week, every day since then has made a higher low and closed above its open. We simply have strong bullishness that is cutting through resistance easily. The resistance level at 101.50 is still on the chart but might not be of any significance now. The previous resistance at 100.43 may act as support if/when it is retested.
The next resistance level is a weekly high from May this year confluent with a key psychological number: 102.50. This is a level to watch out for with a confirmed short trade possible under relaxed market conditions. Beyond that, there are only 103.72 and then 5 year highs.
It is obvious that conditions are very bullish, so bullish that it could be dangerous to pick a top or assume that the move cannot go on much further.
Therefore the following conclusions can be drawn:
1. Bullish bias.
2. Good levels to seek long entries are any pullbacks to 101.10, 100.85, 100.50.
3. A sustained break below 100.50 calls the medium-term uptrend into question.
4. If the uptrend continues, the price may find it hard or impossible to break through 102.50.
5. It is possible to take a cautious short at 102.50 and to hold it for a while if risk can be taken off easily.
6. If the price makes a sustained break above 102.50, that will be a very bullish sign, with the 5 year high resistance level next at 103.72.


