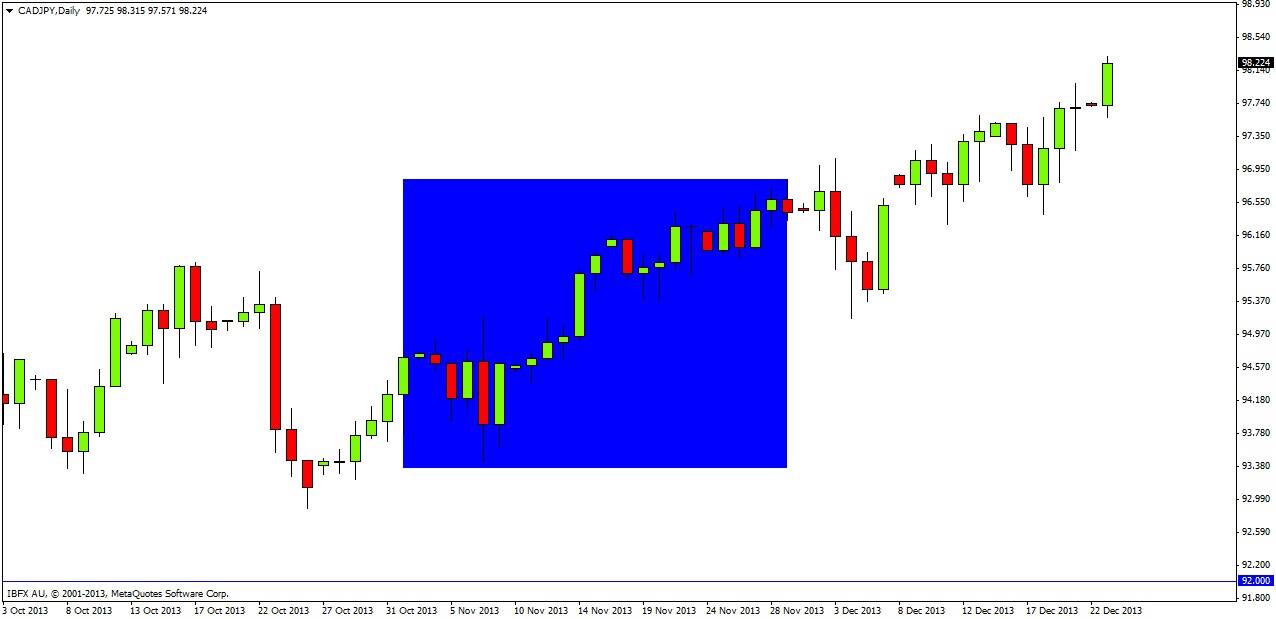
In his forecast published on 31 October 2013, Christopher Lewis made the following predictions for the coming month:
The cross was very strongly supported between 88 and 92.
There should be a move up following a supportive weekly candle, or alternatively after some kind of shorter-term supportive candle forming close to the 92 level.
The price should be at 96 or higher at the end of November.
Let’s now take a look and see what happened during November 2013 in order to determine whether Chris’ predictions turned out to be accurate:
The shaded blue area shows the period of November 2013 on the daily chart above.
We can see the following from the above chart:
The price ended the month at 96.43, so Chris’ forecast about the price being equal to or greater than the 96 level was spot on.
The price did not pull back closer to the 92 level, falling at its lowest barely below 93.50. Therefore there was no shorter-term support candle to support his recommended long entry. However, on the weekly chart, the first week of November produced a very supportive fat bullish inside candle closing hard on its high. This provided the recommended supportive weekly candle mentioned by Chris, giving a long entry at 94.75 or lower if you had waited for the pull-back.
The support zone deemed to be present between 88 and 92 has not been tested to date, so it impossible to judge or verify this part of the prediction.
This was a great forecast. Most importantly above all else, it provided a clear route to entry by recommending a long after a supportive weekly candle. This trade could have been held to date through December: the price has continued to rise strongly, as can be seen in the chart above.


