USD/JPY Signal Update
Wednesday’s signals were not triggered and expired.
Today’s USD/JPY Signals
Risk 0.50%.
Entry should be made before 8am tomorrow morning London time.
Long Trade 1
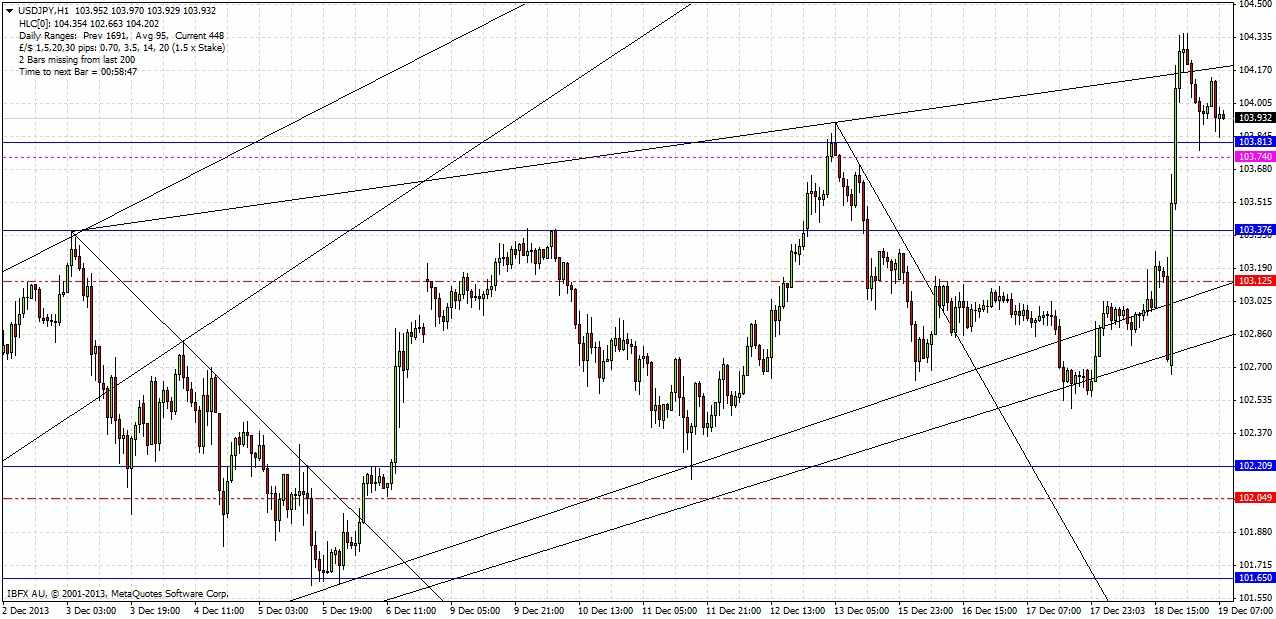
Enter long at the next bar break of an hourly pin or strong outside bar rejecting and closing above 103.37 and one of the bullish channel trend lines. Ideally the bar would also reject today’s S1 daily pivot point at 103.12. If this level is not touched and rejected by the same hourly bar, or if an hourly bar closes more than a few pips below it, the trade is immediately invalidated and should not be taken.
Stop loss at the local swing low or 102.88, depending upon how close the entry is to 103.37. If the entry is very close, then the lower of the two should definitely be used.
Take profit on 75% of the position at 103.82, move the stop loss to break even, and leave the rest to ride.
USD/JPY Analysis
No major data is expected today for the JPY.
Yesterday’s FOMC statement has changed the market sentiment to be markedly more positive on the USD. The USD rose sharply against the JPY and also against the EUR.
There is important news today for the USD at 1:30pm (Unemployment Claims) and 5pm (Existing Home Sales and Philly Fed Manufacturing Index) London time.
Last night this pair made a new 5-year high at 104.35.
Interestingly, the bullish channel has more or less held, despite its having frayed slightly at both the top and the bottom:
So far the evidence is that the previous resistance level of 103.82 has flipped and turned into support, although as it has already been tested earlier in today’s Asian session I do not want to look for a long trade there.
A better bet for a long trade would be a price action rejection of confluence between one of the lower channel trend lines and the level at 103.37 which may next act as support, although this is uncertain.
Due the USD bullishness and general bullish momentum we have seen in this pair, I am not looking for any short trades. We do not have any real known resistance levels above us in any case.
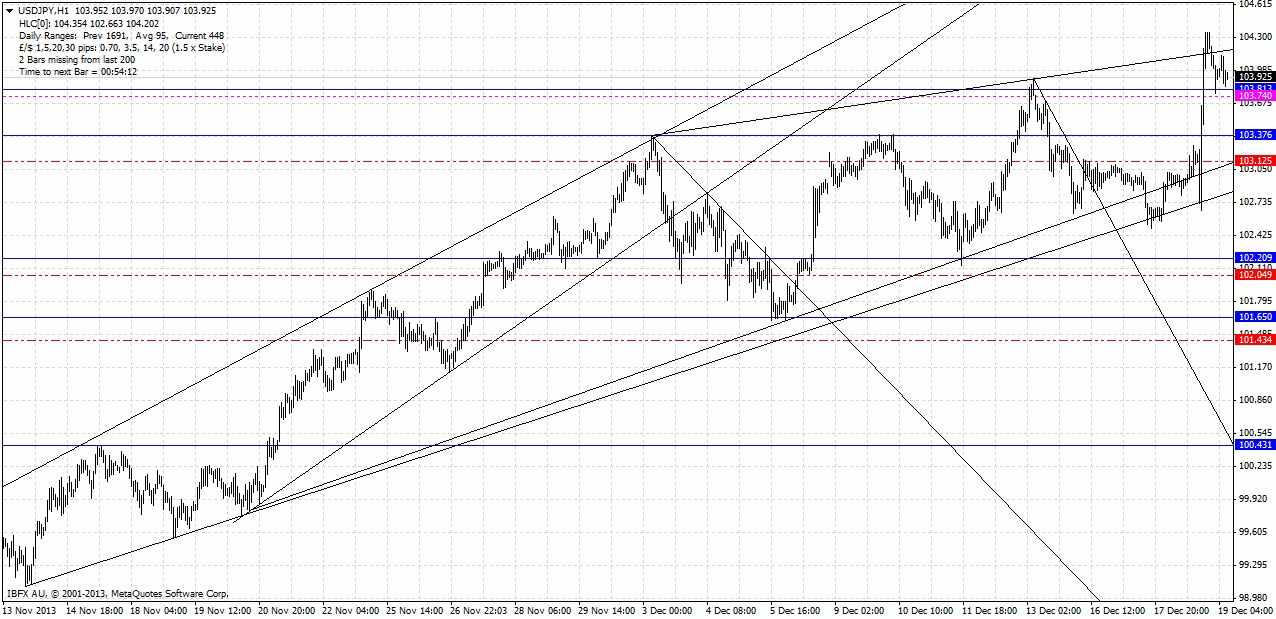
Here is a zoomed-out version of the chart so the bigger picture can be seen:


