Forecasts as far ahead as several weeks should always be taken with a pinch of salt as the underlying circumstances of the market may change fundamentally over such a long period of time. However, it is possible to have some predictability if there are no dramatic market events over the month.
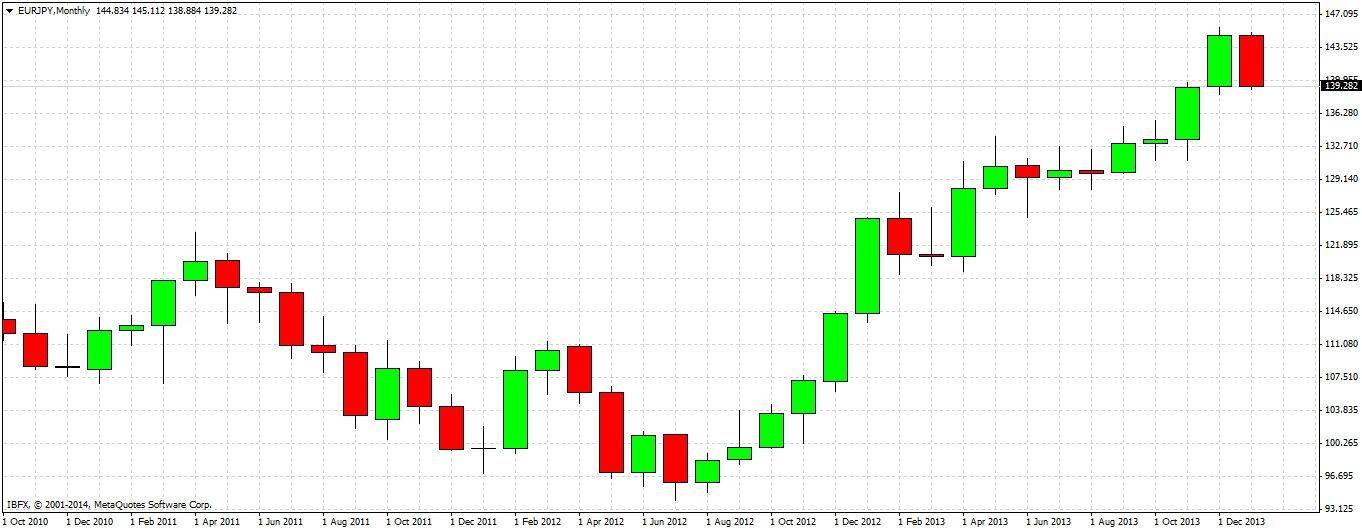
This cross has been established in a strong long-term uptrend since the summer of 2012, and has been rising strongly in its recent leg to reach a five-year high, but it is beginning to show signs of weakening or at least slowing. A monthly close below 139.25 will indicate bearishness especially if the monthly low is then quickly broken to the down side, with a logical target for the downwads move being somewhere between 136.00 and 135.00.
Technical Analysis
Since the summer of 2012, the pair has been in a very strong uptrend that began near 10-year historic lows, with not a single monthly bearish engulfing candle having printed during this time. We are today at a small crossroads, as the January monthly candle will be a bearish engulfing candle if it closes below 139.25. At the time of writing, the price is right on this number. It is hard to identify any strong support before 136.00:
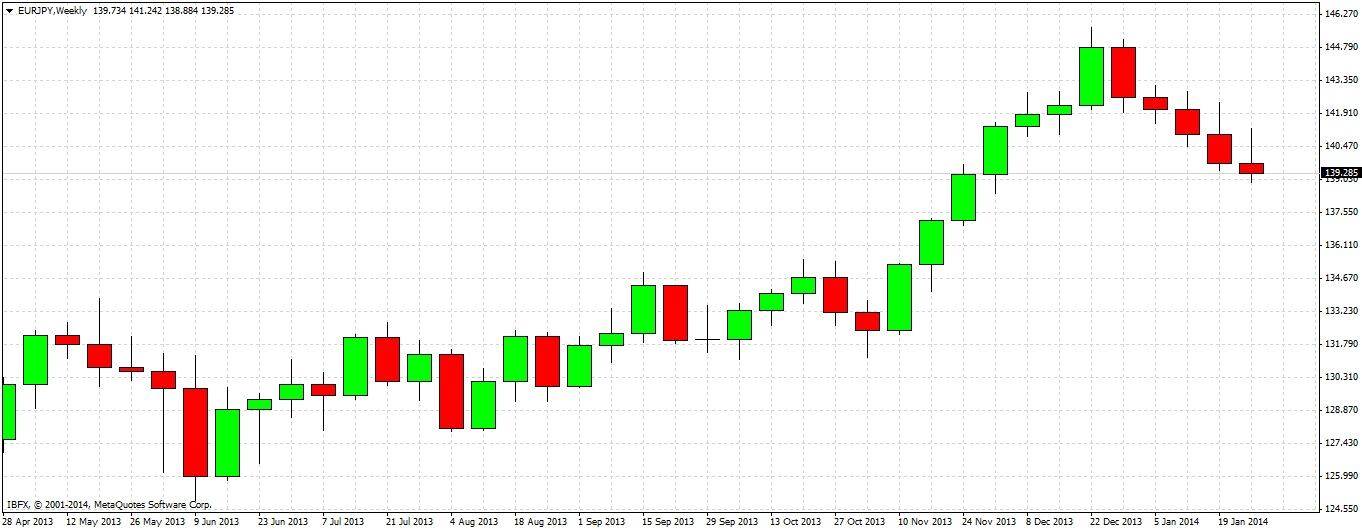
The weekly chart shows a steady fall, with each week of January printing a bearish candle. This is a sign that the uptrend may well be over:
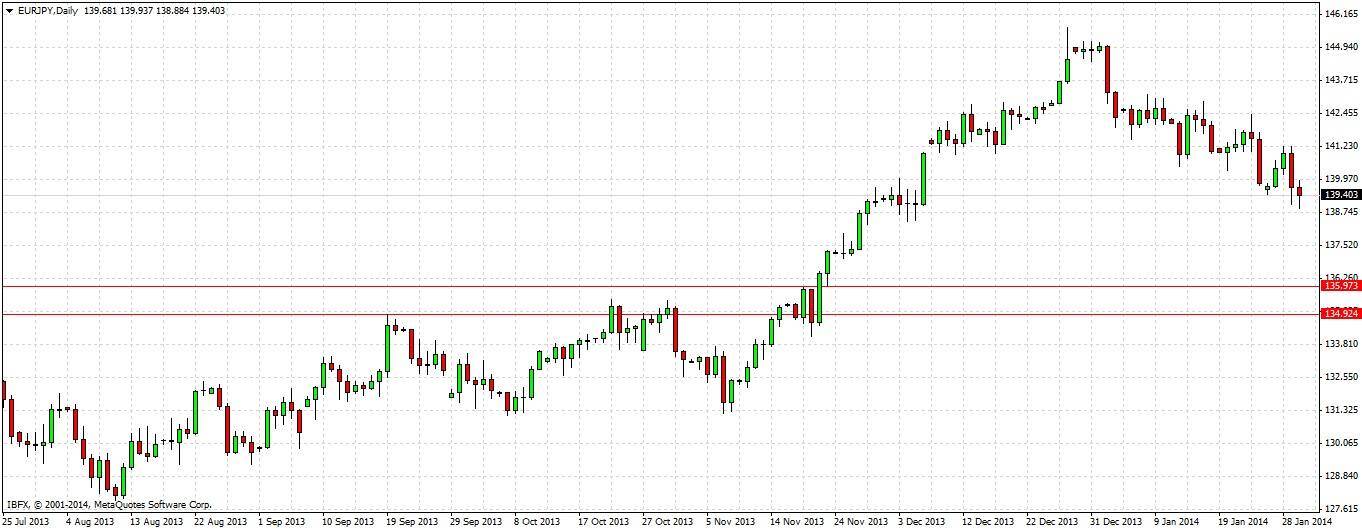
The daily chart shows essentially the same picture as the weekly chart.
A monthly close below 139.25 will indicate bearishness especially if the monthly low is then quickly broken to the down side. The logic target of the downwards move would be somewhere between 135.00 and 136.00, which is likely to act as support after having previously been strong resistance continuously between September and November last year:


