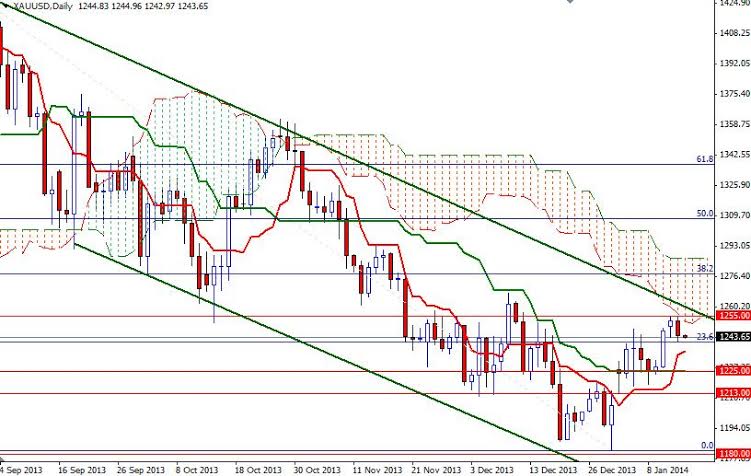
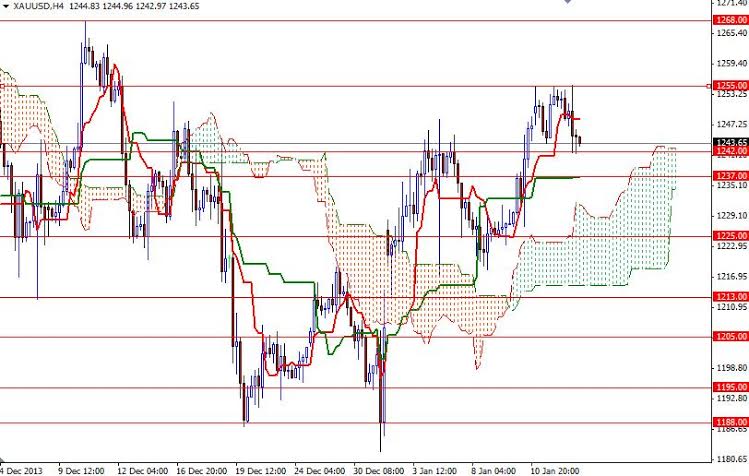
Gold prices ended yesterday's session lower after encountering resistance around the 1255 level, which happens to be the bottom of the Ichimoku clouds on the daily chart. Yesterday the XAU/USD pair tried to break through but stronger-than-expected December U.S. retail sales data and hawkish comments from top Federal Reserve officials helped sellers to defend this resistance area. Both Philadelphia Fed President Charles Plosser and Dallas Fed President Richard Fisher backed further tapering of the central bank’s asset-buying program and said the central bank should end purchases before late 2014. The XAU/USD pair traded as low as 1241.60 during today's Asian session and it seems that there is more strength behind the bears at the moment.
Over the last two weeks, I have been bullish, thinking that gold prices will touch the top of the descending channel but at this point I will be looking signs of weakness to go short. If the bulls can't hold prices above the 1242 level (Fibonacci 23.6 level based on the bearish run from 1433.70 to 1182.35), we might see the market pulling back to the Tenkan-sen line (nine-period moving average, red line) which currently sits around 1237/5.
If this area is breached, it is likely that we will see the bears testing the next strong support at 1225. In order to regain their strength, the bulls will have to protect their first camp at 1237 and push prices above the 1247 level once again. In that case, they will have another chance to test the 1255 and 1262 resistance levels. I see plenty of resistance between 1255 and 1268 but if the bulls somehow get through, that will probably bring more buyers in and then we could see a bullish continuation targeting the 1286 level at least.


