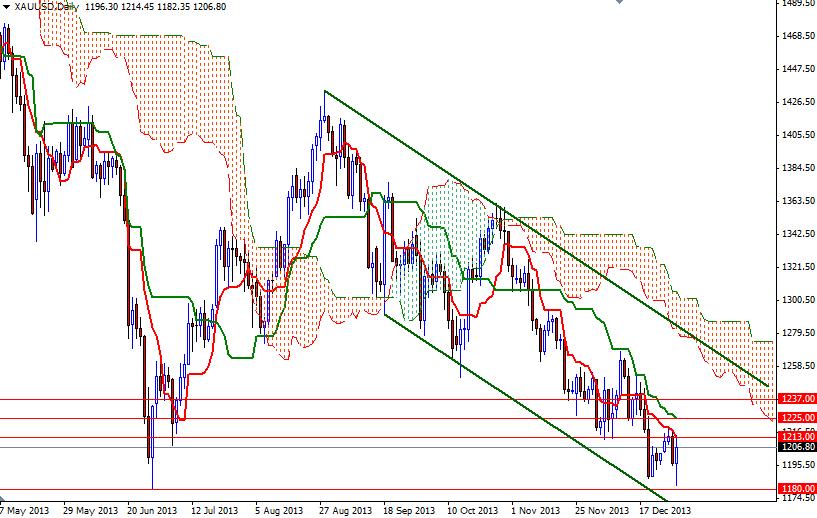
The XAU/USD pair had scored a gain of 0.85% on Tuesday, the last trading day of 2013. However, gold prices fell 28% in 2013 and posted its first annual loss since 2000. Since quantitative easing (i.e. money printing) has been the fundamental driver of higher gold prices since 2008, growing perception that the Federal Reserve will turn down the tap on its $85bn/month stimulus package created the exodus out of gold.
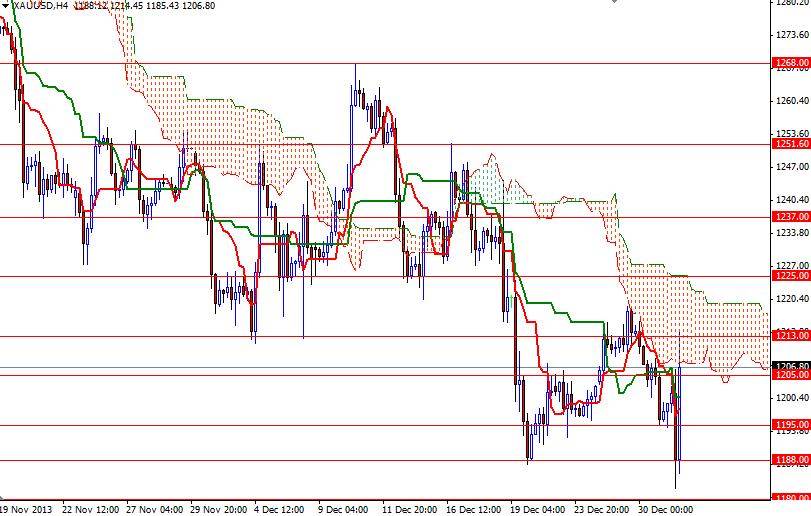
Breaking below the 1532 support was a significant bearish event and the XAU/USD pair has been under a relentless selling pressure since then. Recently, the pair found support around the 1180 level and climbed above 1200. Although the weekly and daily charts suggest that the broader directional bias remains weighted to the downside, the 30M chart is pointing higher prices as we have a bullish Tenkan-sen (nine-period moving average, red line) - Kijun-sen line (twenty six-day moving average, green line) cross and prices are above the Ichimoku clouds.
Today the key levels to watch will be 1195 and 1213. If the 1195 support holds, I will look for prices to retest 1213. If the bulls manage to break through, then the 1225 and 1237 levels will be the next targets. I think the Tuesday's price action proved that breaking below 1180 is essential for a bearish continuation. Only a daily close below 1180 would confirm that the bears are firmly in control and our next stop is the 1160 level. Also bear in mind that the performance of the equity market will likely continue to influence the price of gold.


