Forecasts as far ahead as several weeks should always be taken with a pinch of salt as the underlying circumstances of the market may change fundamentally over such a long period of time. However, it is possible to have some predictability if there are no dramatic market events over the month.
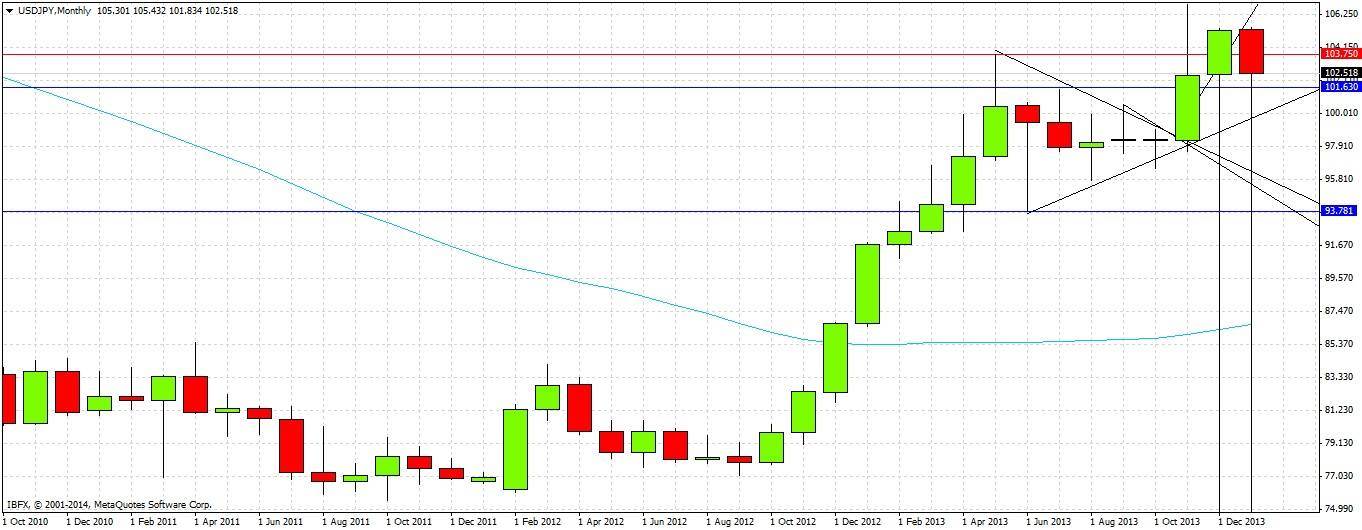
This pair has been established in a strong long-term uptrend since the summer of 2012, and has been rising strongly in its recent leg to reach long-term new highs, but it is beginning to show signs of weakening or at least slowing. A monthly close below 102.47 will indicate bearishness but it is probable that it is the level of 101.61 that will prove to be truly decisive.
Technical Analysis
Since the summer of 2012, the pair has been in a very strong uptrend that began near some very historic lows, with not a single monthly bearish engulfing candle having printed during this time. We are today at a small crossroads, as the January monthly candle will be a bearish engulfing candle if it closes below 102.47. At the time of writing, the price is right on this number. Despite this, there is strong support below us at 101.63 as well as an intact long-term bearish trend line, showing that the price is still established within a bullish channel, although earlier bullish channels were broken to the down side during January. :
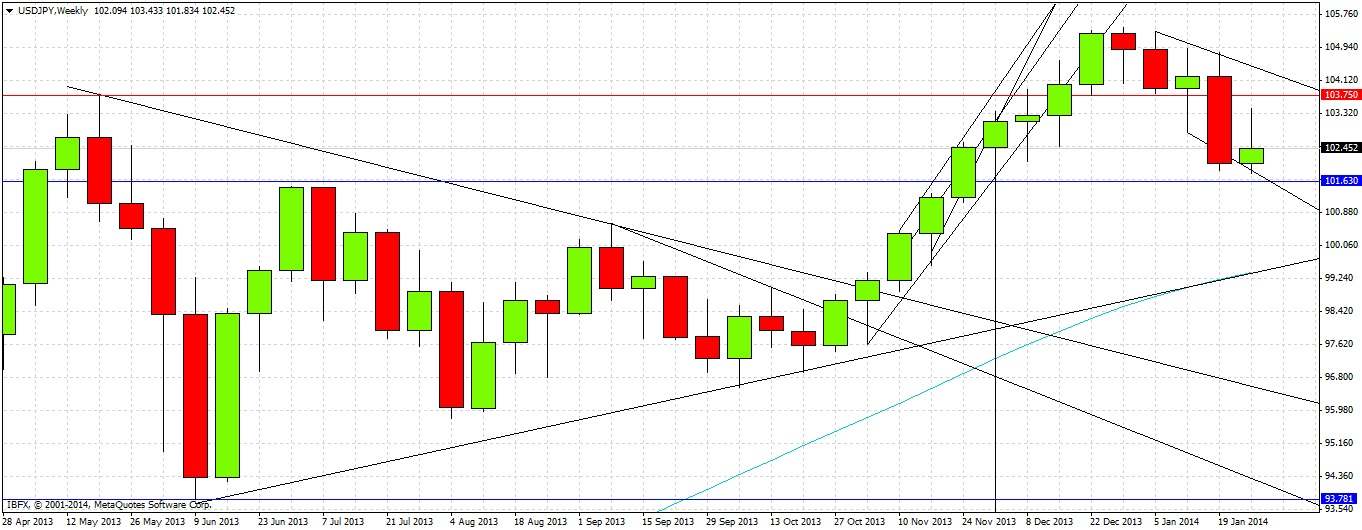
The weekly chart shows that since last October's bullish breakout from a consolidation triangle, we have not had a single bearish engulfing candle until the week before last. This is a sign that the uptrend though still established, is beginning to weaken. The chart also shows recent bearish candles are relatively large, suggesting impulsiveness:
The daily chart (not shown) shows the same picture as the weekly chart.
Although a January close below 102.47 will suggest a bearish February, it seems more likely that it is the level of 101.61, which was December's low, will be be more decisive in determining whether we continue downwards or reverse and continue the previous uptrend.
A downwards move should run into support at around 101.00 or 100.50, especially if one of these levels is confluent with the remaining bullish trend line when the price arrives there. An upwards move will probably run into resistance close to 105.00.


