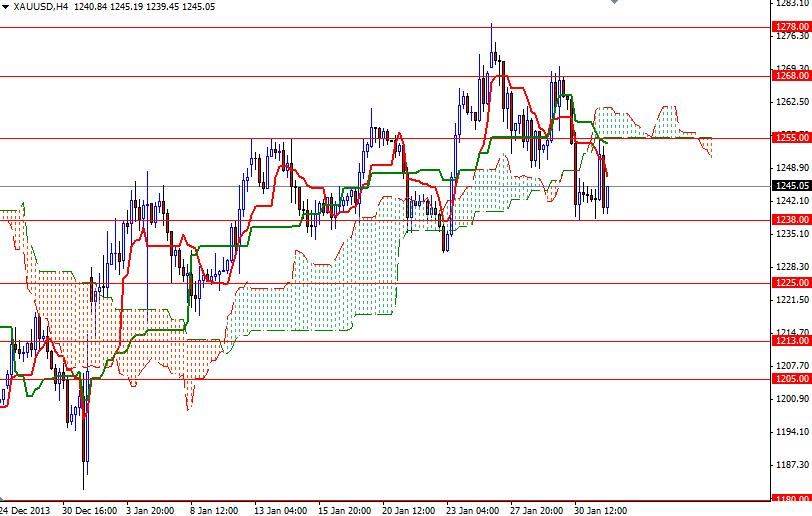
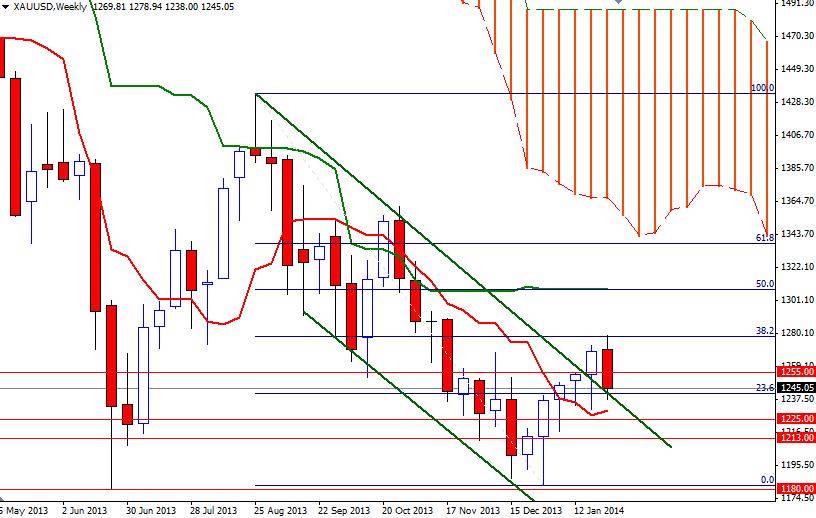
The XAU/USD pair closed the week lower after five consecutive weeks of gains as the bulls encountered heavy resistance in the 1268 - 1278 zone. The precious metal fell around 1.94% for the week but gained roughly 1.52% in January. Last Friday, the pair tried to climb above the 1255 level, where the Ichimoku clouds reside on the 4-hour chart, but failed to break through. As a result, we are stuck in the 1238 - 1255 area.
Recently, pullbacks in equities markets increased desire for safe haven diversification and put the precious metal back in the spotlights. U.S. data released last week were not as strong as hoped but were more or less in line with market expectations. From a technical point of view, short-term and long-term charts are giving us mixed signals. The 4-hour chart is favoring the bears as prices are below the Ichimoku cloud.
We also have a bearish Tenkan-sen (nine-period moving average, red line) - Kijun-sen (twenty six-day moving average, green line) cross. However, the pair is still trapped inside the cloud on the daily time frame and the bulls are trying to hold the market above the 1238 level. If the bears increase downward pressure and pull the XAU/USD pair below 1238, their next target will be the 1230 - 1225 area. A daily close below 1225 would suggest that the market is going to test 1213 next.
To the upside, the first resistance is located at the 1255 level. If prices manage to break through, the next challenges will be waiting the bulls at 1268 and 1278. As usual in the first week of the month -aside from the central banks' meetings- market participants will have plenty of economic data to digest, including ISM services and manufacturing activity surveys, factory orders, non-farm payrolls and unemployment rate.


