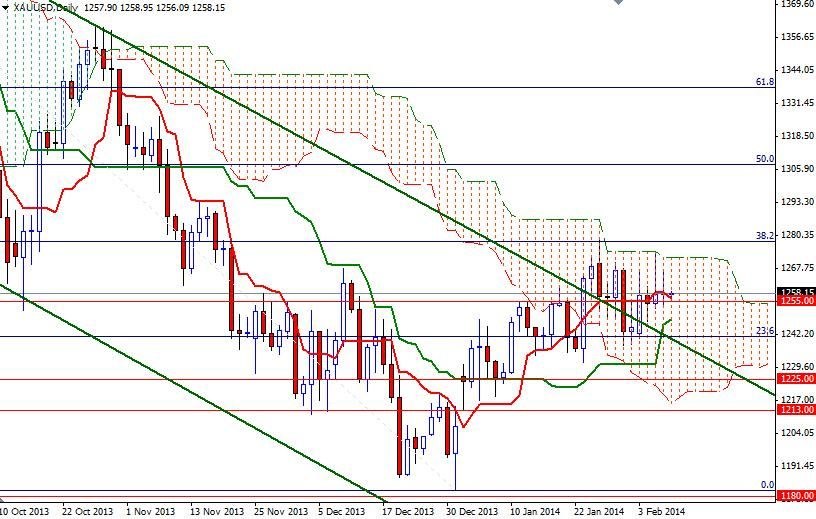
The XAU/USD pair was trading at the same level when I wrote yesterday's analysis. We have been going back and forth for the last 10 days roughly between the Fibonacci 23.6 and 38.2 levels (based on the bearish run from 1433.70 to 1182.35) as the market simply had no real catalyst to push prices in either direction. However, this is not technically surprising because as I mentioned earlier this week, trading within the boundaries of the Ichimoku cloud on the daily chart suggests the trend is flat. Global stock markets are stabilizing, easing the demand for disaster insurance, but mixed data out of the United States is putting pressure on the American dollar.
According to a report released by the Commerce Department, the trade deficit expanded to $38.7 billion in December from a revised $34.6 billion in November. Separately, the Labor Department reported that the number of Americans filing first-time claims for unemployment insurance payments decreased by 20K to 331K. Since the Federal Reserve ties future monetary policy to labor market conditions, investors will pay extra attention to the U.S. non-farm payrolls data due later today.
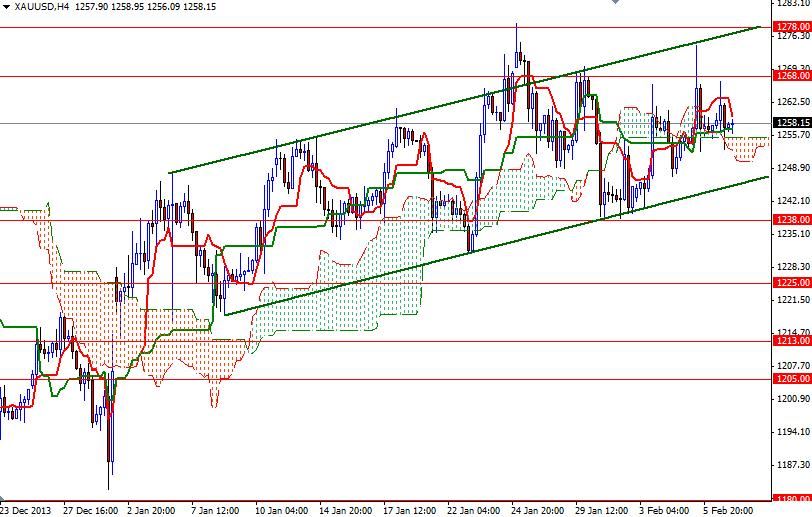
From a technical point of view, trading above the Ichimoku clouds on the 4-hour time frame is positive. There is a bullish Tenkan-sen (nine-period moving average, red line) - Kijun-sen (twenty six-day moving average, green line) cross as well. If the bulls manage to hold prices above the clouds, they might have another chance to tackle the first important barrier at 1268. A sustained break above that level would make me think that 1274.48 and 1278 will be the bulls' next targets. The bears will need to capture the 1245 support level -where the bottom of the ascending channel currently resides- in order to increase their strength. If this support gives way, we might see prices falling back to 1238. A daily close below the 1238 support level could increase speculative selling pressure.


